 The pickings are extremely thin in the markets because the vast majority of groups are in downtrends. TrendInvestorPro tracks trend signals in 274 ETFs. This list include 170 stock-based ETFs, 18 fixed income ETFs, 17 commodity ETFs, 9 currency ETFs and 60 non-US ETFs. Only 14 (5.1%) of the 274 are in uptrends.
My scanned used the Rate-of-Change of the 200-day SMA and the percentage difference between the 5-day SMA and 200-day SMA to define uptrends. The 200-day SMA is rising when its 5-day ROC is positive and the trend is up when the 5-day is above the 200-day. Only 14 ETFs had a rising 200-day and a 5-day SMA above the 200-day SMA.
Unsurprisingly, 8 of the 14 are energy-related ETFs (FCG, XOP, DBE, XLE, RYE, PSCE, IGE, AMLP). There are two commodity ETFs in the mix (CORN, PALL). Three non-US ETFs (TUR, ILF, EWZ) and, of course, the Dollar Bullish ETF (UUP). Today I would like the focus on the Palladium ETF (PALL) because it sports an uptrend overall and an advance since summer.
The chart below shows PALL with the 200-day SMA and the 5-day SMA in the main window. The first indicator window shows the Moving Average Trend, which is the 5-day ROC of the 200-day SMA. I added a signal filter at .30 and -.30 (green/red lines) to reduce whipsaws. The lower window shows the percentage difference between the 5-day SMA and 200-day SMA. I added a signal filter at 5% and -5% to reduce whipsaws.
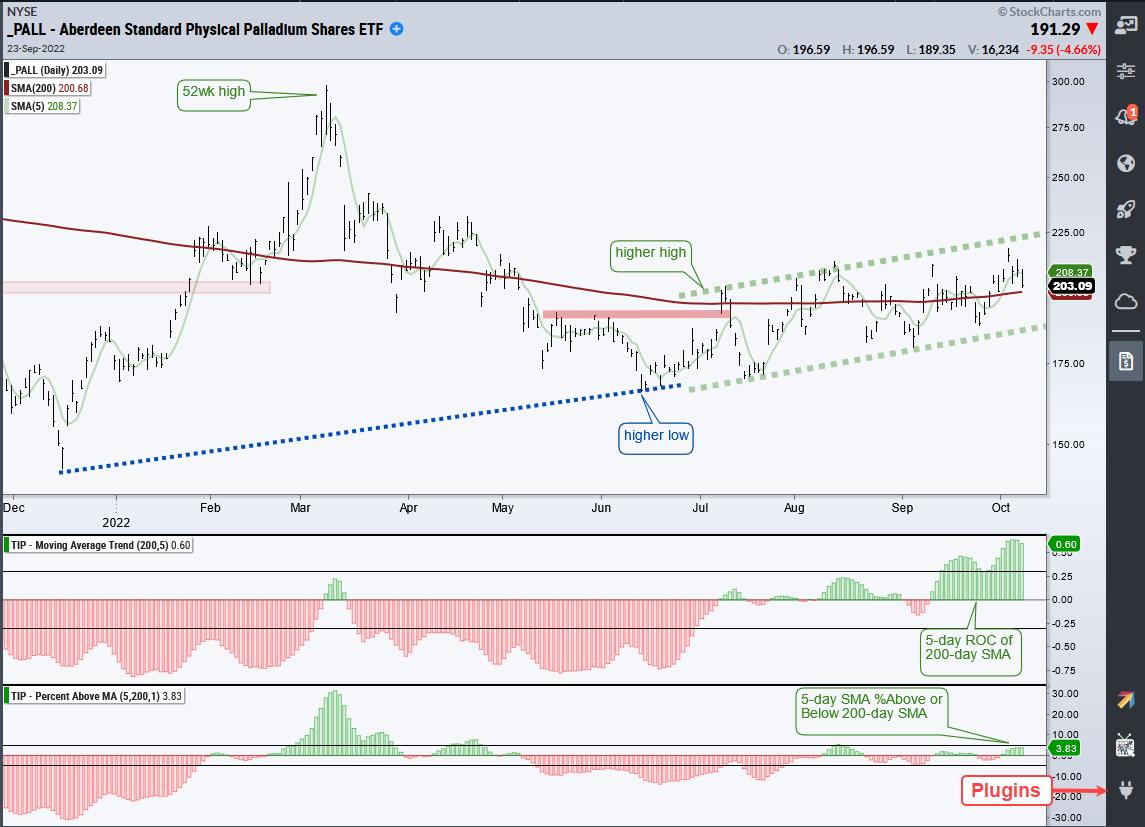
On the price chart, PALL formed a higher low from December to June and has been rising since the June low. The green dashed lines show a rising channel (uptrend). The Moving Average Trend indicator exceeded .30 in mid September and this reflects a firmly rising 200-day SMA. The Percent Above MA indicator exceeded 5% on August 12th and has yet to dip below -5%, which would reverse the signal. All in all, the Palladium ETF is performing well in a seriously warped market. A close below the September lows would call for a re-evaluation.
TrendInvestorPro remains very defensive and has been since the Composite Breadth Model turned bearish on April 11th. Yield spreads are rising and the vast majority of stock-based ETFs are in downtrends. The bear market will end one day and I recently published a report and video analyzing past bear markets for clues on the current bear market. Click here for immediate access.
Moving Average Trend, Percent Above MA and nine other indicators are part of the TrendInvestorPro Indicator Edge Plugin for StockCharts ACP. Click here to learn more and take your analysis process to the next level.
---------------------------------------
Choose a Strategy, Develop a Plan and Follow a Process
Arthur Hill, CMT
Chief Technical Strategist, TrendInvestorPro.com
Author, Define the Trend and Trade the Trend
Want to stay up to date with Arthur's latest market insights?
– Follow @ArthurHill on Twitter


