Small-caps are leading the way lower and breadth indicators are showing some serious deterioration under the surface. Large-caps are holding up for now, but keep in mind that weakness in small-caps foreshadowed the January 2022 peak in SPY. Today's article will compare price charts for SPY and IWM, and then look at the bearish signal in the Composite Breadth Model.
Small-caps are leading the way lower because the Russell 2000 ETF (IWM) and the Russell Microcap ETF (IWC) are in downtrends, per the Trend Composite. Also note that IWC recorded a 52-week low this week. The chart below shows IWM falling from November 2021 to June 2022 and then consolidating with a large Symmetrical Triangle. A consolidation after a large decline is typically a continuation pattern that represents a rest within the bigger downtrend. IWM broke the triangle line and this signals a continuation lower.
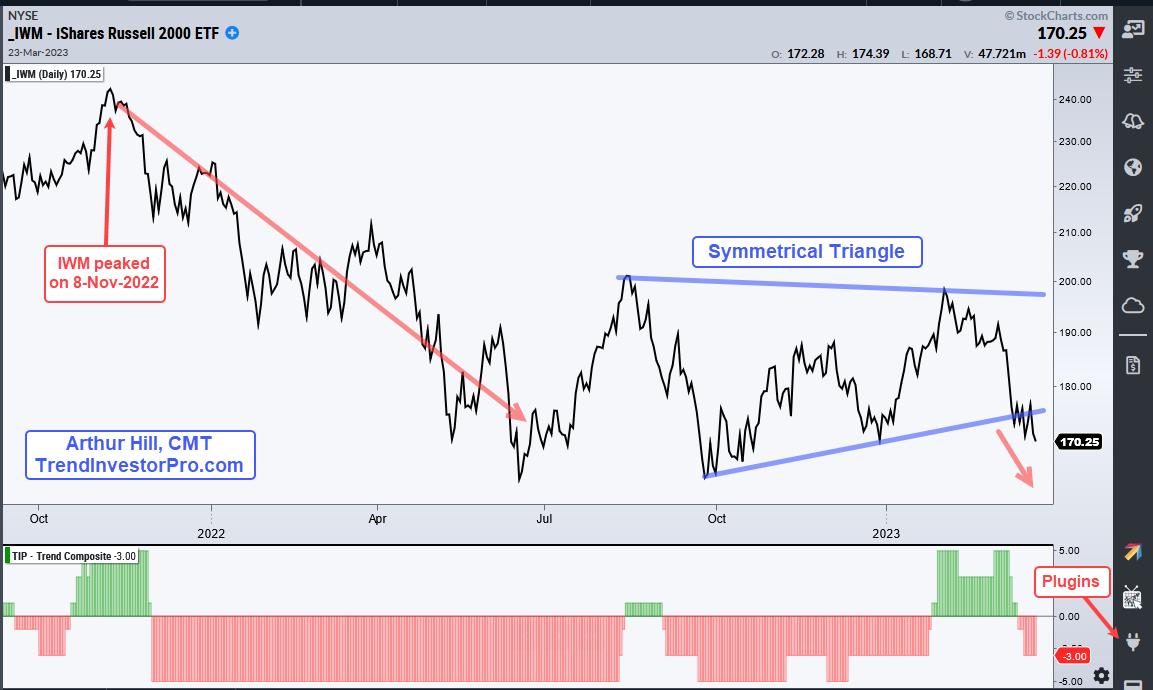
Note that IWM peaked on 8-November-2021 and SPY peaked on 3-January-2022, some two months after IWM. This means IWM led the way lower and foreshadowed the market peak in January 2022. Flash forward to March 2023 and we have IWM leading lower again. SPY remains well above its December low and is down just .78% in March. IWM, on the other hand, closed below its December (closing) low on Thursday and is down 9.53% in March. The chart below show SPY breaking wedge support and this break is bearish.
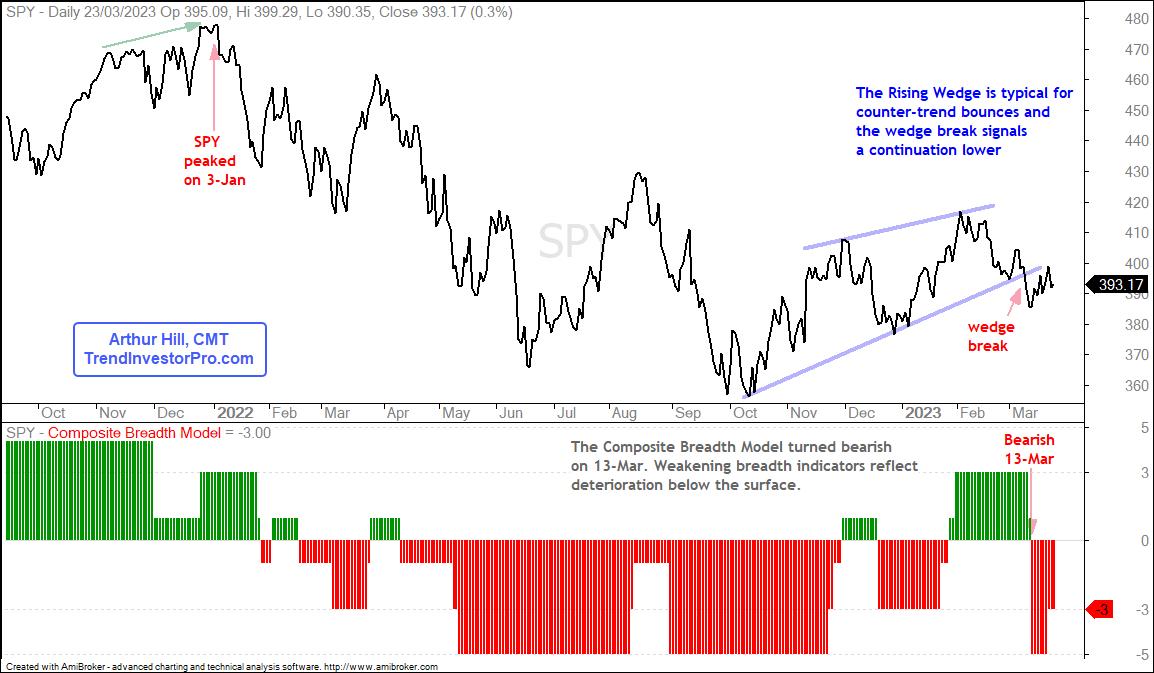
The generals are likely to follow the troops. The indicator window on the chart above shows the Composite Breadth Model turning bearish on March 13th. This model uses fourteen breadth indicators from the S&P 500 and S&P 1500. There are many more small-cap stocks (troops) than large-caps stocks (generals) and this means breadth indicators reflect performance for smaller stocks. SPY is a market-cap weighted ETF that reflects performance for large-caps. Even though the generals (SPY, QQQ) are holding up, the troops (small-caps) are retreating and I expect the generals to follow.
The Composite Breadth Model (CBM) is our main market timing tool at TrendInvestorPro. This model measures the weight of the evidence for the stock market as a whole and acts as our market filter for trend and momentum strategies. Whipsaws happen, but our quantified results show that market filters improve returns and greatly reduce drawdowns over the long-term. Click here to learn more about our trend-momentum strategies and mean-reversion strategy for trading ETFs.
The Trend Composite, ATR Trailing Stop and nine other indicators are part of the TrendInvestorPro Indicator Edge Plugin for StockCharts ACP. Click here to take your analysis process to the next level.
---------------------------------------
Choose a Strategy, Develop a Plan and Follow a Process
Arthur Hill, CMT
Chief Technical Strategist, TrendInvestorPro.com
Author, Define the Trend and Trade the Trend
Want to stay up to date with Arthur's latest market insights?
– Follow @ArthurHill on Twitter


