 Overbought and oversold conditions are tricky because stocks can become overbought/oversold and remain overbought/oversold as the move continues. This is why traders need another indicator or chart signal for confirmation. Today's article to look at some recent overbought/oversold conditions and use the PPO for timing.
The chart below shows the McClellan Oscillator for the S&P 500 in the middle window. I set overbought at +90 and oversold at -90. The red arrows on the price chart show when the McClellan Oscillator became overbought and the green arrows show when it became oversold. A cluster of overbought or oversold readings count as one. The blue shaded ovals on the McClellan Oscillator plot show some signal clustering.
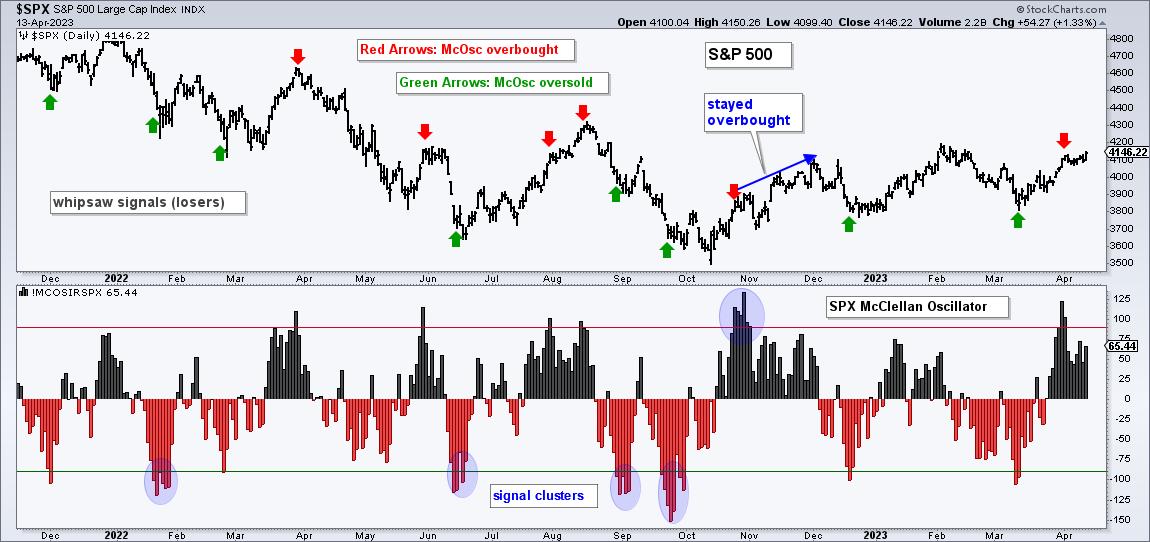
The McClellan Oscillator alerts us when the S&P 500 becomes short-term overbought or oversold. However, the index can become overbought/oversold and remain overbought/oversold. Notice how the McClellan Oscillator exceeded 90 on October 25th and the S&P 500 continued higher for another five weeks (blue arrow). This is why we need the PPO to time a downturn in price.
On the chart below, I am using PPO(10,60,10) because it produces fewer whipsaws than PPO(12,26,9). This version also has more lag because the time periods are longer. That's the trade off! The lower window shows the PPO (black line) and its signal line (red line). Look for bullish signal line crosses after oversold readings in the McClellan Oscillator (green arrow lines) and bearish signal line crosses after overbought readings (red arrow lines).
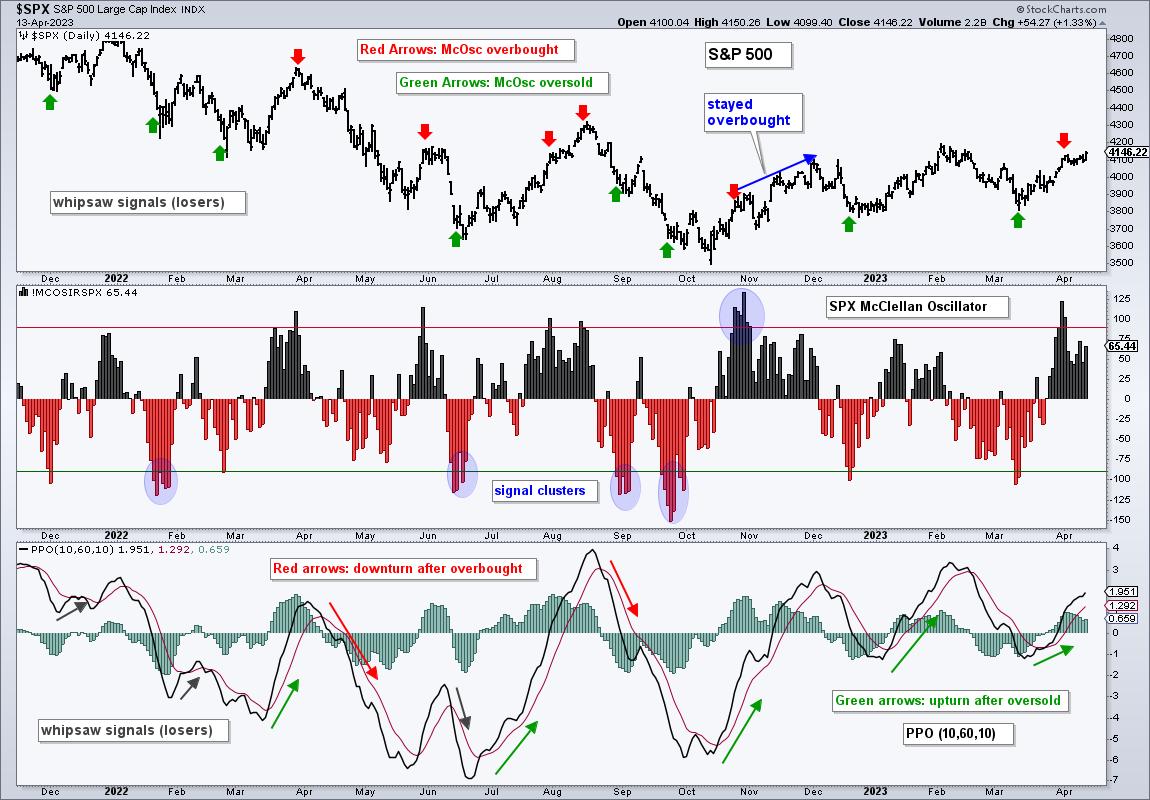
The black arrows on the PPO chart show signals that did not work (December, February and June). The red and green arrow-lines show signals that resulted in sizable swings in the S&P 500. Recent volatility helped because the price swings since April have been rather large.
Most recently, the McClellan Oscillator became overbought on March 31st and April 3rd, but the PPO remains above its signal line. This means the S&P 500 is overbought and still trending higher (short-term). A bearish signal line cross in the PPO would signal a short-term trend reversal.
TrendInvestorPro specializes in rules-based systematic strategies. There is a bull-bear strategy using an all-weather ETF list, a trend-momentum strategy for stock-based ETFs and a mean-reversion strategy for a broad basket of ETFs. These strategies are quantified with backtests and covered in documented in detailed reports. We update signal tables daily. Click here to learn more.
The Trend Composite, ATR Trailing Stop and nine other indicators are part of the TrendInvestorPro Indicator Edge Plugin for StockCharts ACP. Click here to take your analysis process to the next level.
---------------------------------------
Choose a Strategy, Develop a Plan and Follow a Process
Arthur Hill, CMT
Chief Technical Strategist, TrendInvestorPro.com
Author, Define the Trend and Trade the Trend
Want to stay up to date with Arthur's latest market insights?
– Follow @ArthurHill on Twitter


