Chartists can find leaders by ranking ETF performance in ATR multiples, and there is even an indicator for that. Normalized-ROC puts point performance in ATR multiples and we can compare these values against others. Current Normalized-ROC leaders include the Home Construction ETF (13.37), the Technology SPDR (6.40) and the Aerospace & Defense ETF (5.21). Note that TrendInvestorPro (here) recently introduced a quantified strategy that ranks and trades ETFs using Normalized-ROC.
Normalized-ROC (200,20) is the 200-day point change (Dollar change) divided by ATR(20). The 200-day point change is simply the close less the close 200 days ago. We cannot use this point value to compare performance because high-priced ETFs will have higher values than low-priced ETFs. We can make this value comparable by dividing by 20-day ATR, which normalizes the 200-day point change. Normalized-ROC shows the price change in ATR multiples. The higher, the stronger.
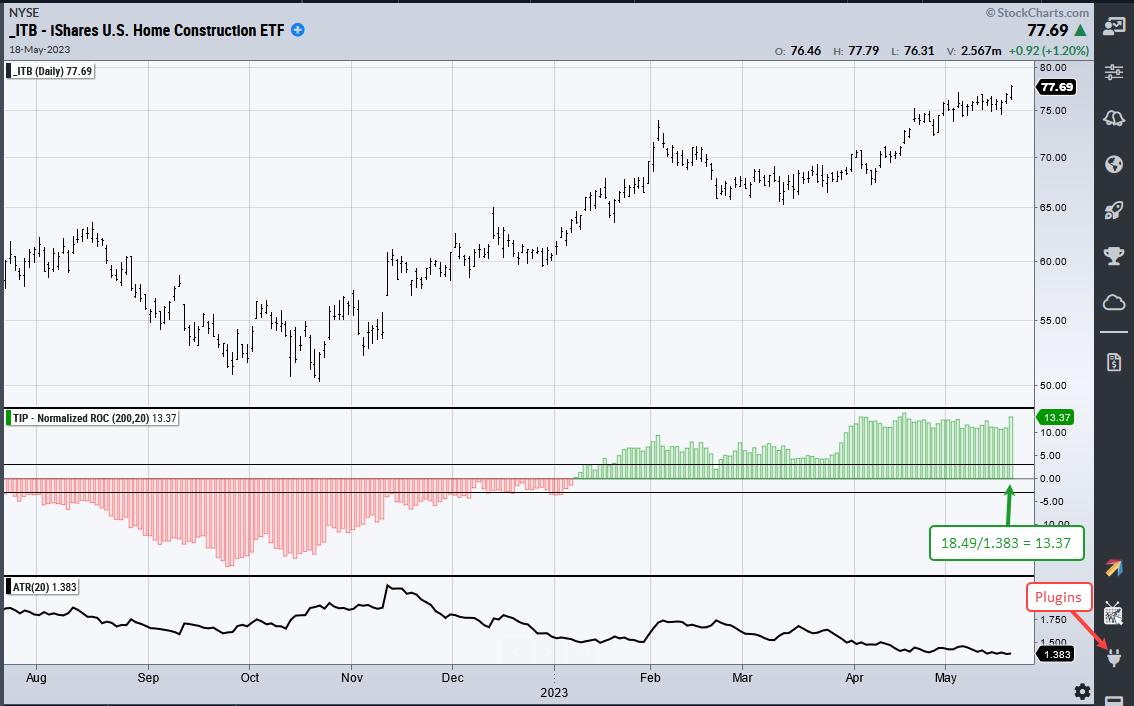
The chart below shows the Home Construction ETF (ITB) with Normalized-ROC (200,20) in the first indicator window and ATR(20) in the lower window. ITB is up $18.49 (points) over the last 200 days and ATR(20) is 1.383. This means Normalized-ROC is 13.37 and ITB is up 13.37 ATR(20) values the last 200 days (18.49/1.383 = 13.37).
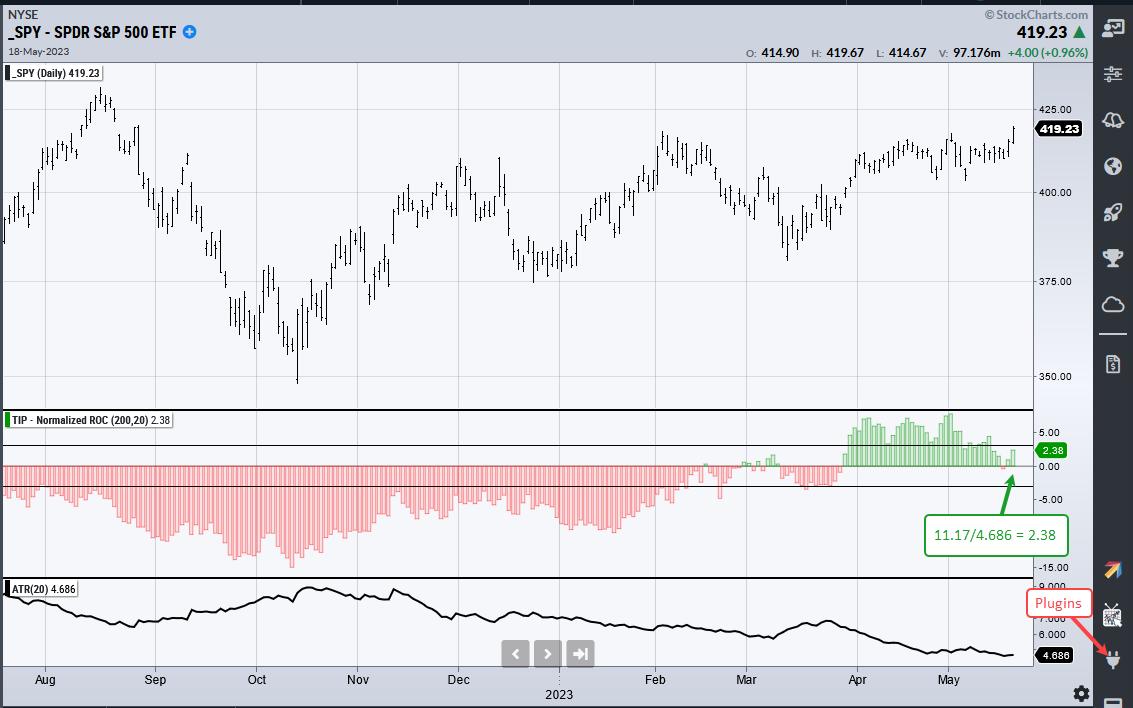
The next chart shows the S&P 500 SPDR (SPY) with the same indicators. SPY is up $11.17 over the last 200 days and ATR(20) is 4.686. Normalized-ROC is 2.38 (11.17/4.686 = 2.38) and this means SPY is up 2.38 ATR(20) values. ITB, in contrast, is up 13.37 ATR(20) values and clearly outperforming SPY. Here are some other leaders: ITB, XHB, GDX, XLK, SPHQ, RCD, PPA, IGA, IVE and QQQ.
Momentum strategies depend on an indicator to rank performance and find the leaders. There are 100s of such indicators, but it is hard to find one that delivers returns that justify the risk. Normalized-ROC is showing promise and details are available at TrendInvestorPro (here).
Normalized-ROC, the Trend Composite, ATR Trailing Stop and nine other indicators are part of the TrendInvestorPro Indicator Edge Plugin for StockCharts ACP. Click here to take your analysis process to the next level.
---------------------------------------------------
Choose a Strategy, Develop a Plan and Follow a Process
Arthur Hill, CMT
Chief Technical Strategist, TrendInvestorPro.com
Author, Define the Trend and Trade the Trend
Want to stay up to date with Arthur's latest market insights?
– Follow @ArthurHill on Twitter
