It does not always happen, but sometimes the indicator and chart signals align to send a powerful message. Datadog (DDOG) sports a confirmed bullish reversal on the price chart and a trend signal from the Trend Composite. Today's article will review these signals and highlight a developing short-term pattern.
The chart below shows Datadog with a confirmed bullish reversal pattern. First, DDOG formed two lows in the low 60s for a Double Bottom (green lines). These lows represent an area of demand (support) in the low 60s. The peak between these two lows marks overhead supply (resistance). Demand prevailed over supply as the stock surged above the red resistance line.
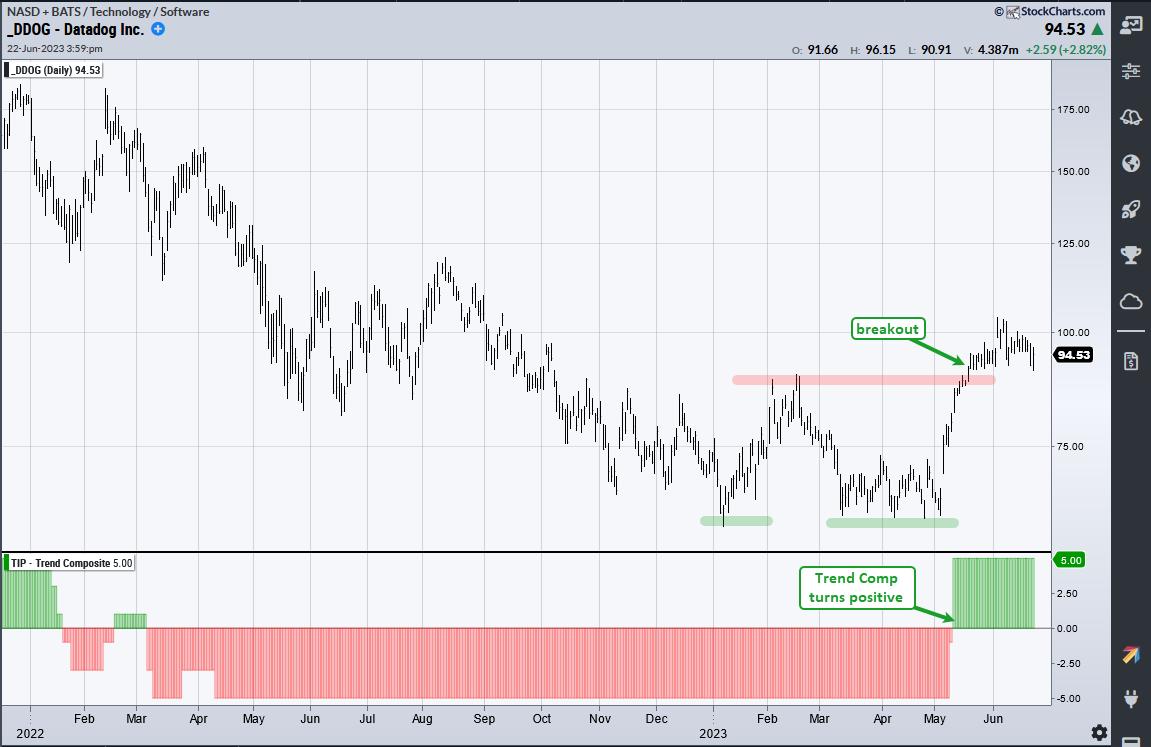
The indicator window shows the Trend Composite turning positive just before the Double Bottom breakout. The Trend Composite aggregates signals in five trend-following indicators. It surged to +5 and this means all five indicators are bullish. This signal reverses the bearish signal from March 7th, 2022.
With the long-term trend up, it is now time to look for tradable pullbacks or short-term oversold conditions. The next chart shows broken resistance at 90 (red line) turning into support (green line). This is a classic tenet of technical analysis. One price breaks resistance and demand overpowers supply, the previous supply overhang becomes an area of demand (support).
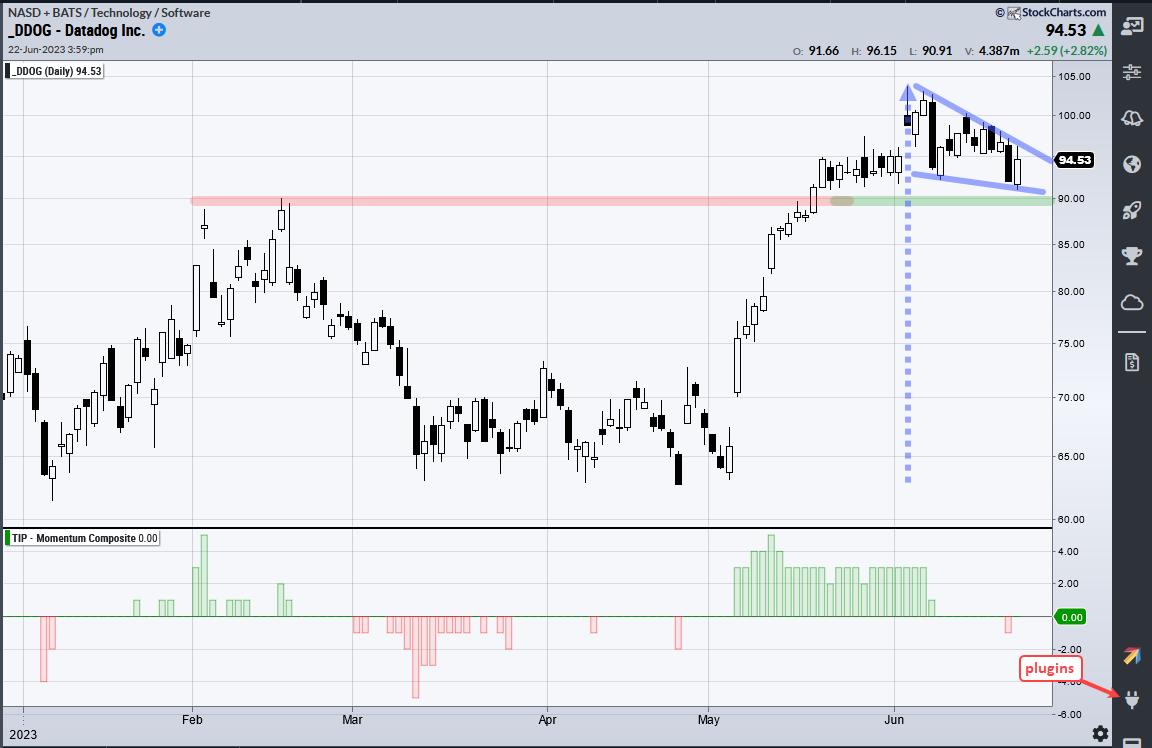
DDOG pulled back to the breakout with a pennant in June. This is a short-term bullish continuation pattern that is dependent on the prior move for a directional bias. The prior move was up (early May to early June) so this is a bullish continuation pattern. A breakout here would be bullish. Barring a breakout, chartists can watch the Momentum Composite for a move to -3 or lower to signal a short-term oversold condition.
A rotation strategy trading S&P 500 and Nasdaq 100 stocks was just released at TrendInvestorPro. This strategy trades weekly using two trend indicators, two volatility filters and a ranking indicator. Strategy and performance metrics are detailed in a comprehensive article. We will complete this series and introduce a signal table next week. Click here to learn more.
The Trend Composite, Momentum Composite, ATR Trailing Stop and eight other indicators are part of the TrendInvestorPro Indicator Edge Plugin for StockCharts ACP. Click here to take your analysis process to the next level.
---------------------------------------
Choose a Strategy, Develop a Plan and Follow a Process
Arthur Hill, CMT
Chief Technical Strategist, TrendInvestorPro.com
Author, Define the Trend and Trade the Trend
Want to stay up to date with Arthur's latest market insights?
– Follow @ArthurHill on Twitter


