 Most stocks surged with the broader market in the fourth quarter of 2023. SPY and QQQ extended their advances in 2024, but some stocks did not partake and fell back. Even so, some of these stocks show signs of long-term trend reversals and their declines in 2024 look corrective. This week I am focusing on one such stock. Crown Castle (CCI) shows signs of an emerging uptrend and the stock sports a tradable pattern after the pullback. This is our specialty at TrendInvestorPro.
The chart below shows weekly candlesticks for Crown Castle (CCI) with the 40-week SMA (red) and the 10-week SMA (green). These moving averages are equivalent to the 200 and 50 day SMAs. After an extended downtrend into October 2023, CCI surged above its 40-week SMA in late November and the 10-week SMA followed with a cross in early January. Not only did the 10-week SMA cross the 40-week, but it did so by more than 5%. This strong cross suggests an uptrend is emerging.
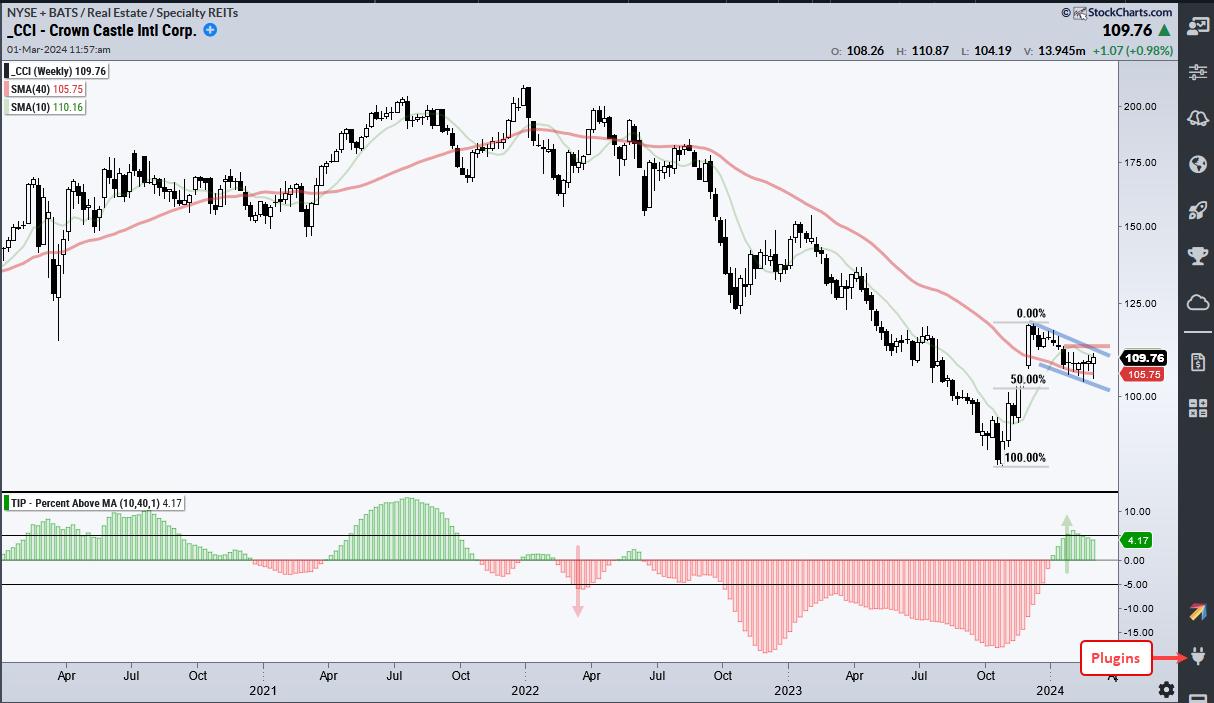
The indicator window shows the percentage difference between the 10-week and 40-week SMAs. I added horizontal lines at +5% and -5% to further filter signals and reduce whipsaws. A move above +5% is bullish and a move below -5% is bearish. This indicator was bullish from May 2017 until March 2022, which is when it crossed below -5%. Percent above MA (10,40,1) then crossed above +5% to turn bullish in early January. Note that this indicator is part of the TIP Indicator Edge Plugin for StockCharts ACP.
A bullish pattern and a breakout would signal a continuation higher. taking shape. CCI surged some 38% from late October to early December and then corrected into February. This decline looks corrective because it retraced half of the prior surge, formed a falling wedge (blue lines) and returned to the 40-week SMA. A 50% retracement (gray lines) is normal after a correction after a sharp advance. Think two steps forward and one step (50%) backward. The 40-week SMA acts as support and the stock firmed just above this moving average the last six weeks. The only thing missing here is a pattern breakout. I am marking resistance at 113 (red line) and a breakout here would be bullish. Upon a breakout, I would re-evaluate on a close below the February lows.
Chart Trader reports and videos focus on stocks and ETFs with uptrends and tradeable patterns. Each week we cover the overall market environment and then feature highly curated trading ideas. This week we covered the Uranium ETF, the Metals & Mining SPDR, CoStar, Zoetis, Cardinal Health and much more. Click here to learn more and get immediate access.
///////////////////////////////////
Choose a Strategy, Develop a Plan and Follow a Process
Arthur Hill, CMT
Chief Technical Strategist, TrendInvestorPro.com
Author, Define the Trend and Trade the Trend
Want to stay up to date with Arthur's latest market insights?
– Follow @ArthurHill on Twitter


