Archived News
Members Only
Martin Pring's Market Roundup1mo ago
Stocks May No Longer Be the Preferred Asset Class
A couple of weeks ago, I wrote that stocks were beginning to slip against the gold price. Chart 1 shows that the ratio has now decisively broken below an important uptrend line, marking the lower region of a three-year top Read More
Art's Charts1mo ago

SPY Reverses Long-term Uptrend with Outsized Move - Now What?
The weight of the evidence shifted to the bears over the last few weeks. First, the major index ETFs reversed their long-term uptrends with Bollinger Band signals, our breadth models turned net negative and yield spreads widened Read More
RRG Charts1mo ago

Sector Rotation Breakdown: Spotting Market Leaders Now
In this exclusive StockCharts video, Julius analyzes US sector rotation using Relative Rotation Graphs (RRG), starting with the 11 S&P sectors and breaking them into Offensive, Defensive, and Sensitive sectors to uncover unusual market rotations Read More
ChartWatchers1mo ago

Tariff Turmoil: 3 Stocks You Need To Know Right Now!
No one can predict how tariffs will play out or how severe their effects will be on everything from consumer goods to the broader economy. But investors have gotten a taste of the market chaos such uncertainties can bring Read More
The Mindful Investor1mo ago

Five Stocks Showing Strength in a Bearish Tape
Where can investors find a safe haven during a period of market uncertainty? Personally, I think it's as simple as focusing on the stocks managing to display bullish technical structures at a time when they are becoming remarkably rare! Today, we'll use the StockCharts scan engin Read More
Stock Talk with Joe Rabil1mo ago
Bearish ADX Signal on S&P Plays Out - Now What?
In this exclusive StockCharts video, Joe revisits a critical ADX signal that gave a major market warning, explaining the pattern and a new low ADX setup to watch Read More
ChartWatchers1mo ago

How to Spot a Market Rebound Before Everyone Else Does
Problem: How can you tell if an index is about to reverse—even before the price reflects it? Answer: Look at what's happening internally within the index—in other words, analyze market breadth, also called "participation Read More
ChartWatchers1mo ago

Stock Market Dips Below 200-Day Moving Average: Are Your Investments Ready for a Shift?
The S&P 500 ($SPX), Nasdaq Composite ($COMPQ), and DJIA ($INDU) are trading below their 200-day simple moving averages (SMAs). It doesn't paint an optimistic picture, but the reality is that the stock market's price action is more unpredictable than usual Read More
The Mindful Investor1mo ago
5 Strong Stocks Defying the Bearish Market!
In this video, Dave analyzes the bearish rotation in his Market Trend Model, highlighting the S&P 500 breakdown below the 200-day moving average and its downside potential. He also identifies five strong stocks with bullish technical setups despite market weakness Read More
ChartWatchers1mo ago

Transform Your Investing Strategy: Uncover the 3 Game-Changing Rules
"The trend is your friend, until the end when it bends Read More
DecisionPoint1mo ago

DP Trading Room: Market Sell-Off
The market sell-off continued in earnest after a brief respite on Friday. Uncertainty of geopolitical tensions and tariff talk has spooked the market and given the weakness of mega-cap stocks, we are likely to see more downside before a snapback rally Read More
RRG Charts1mo ago
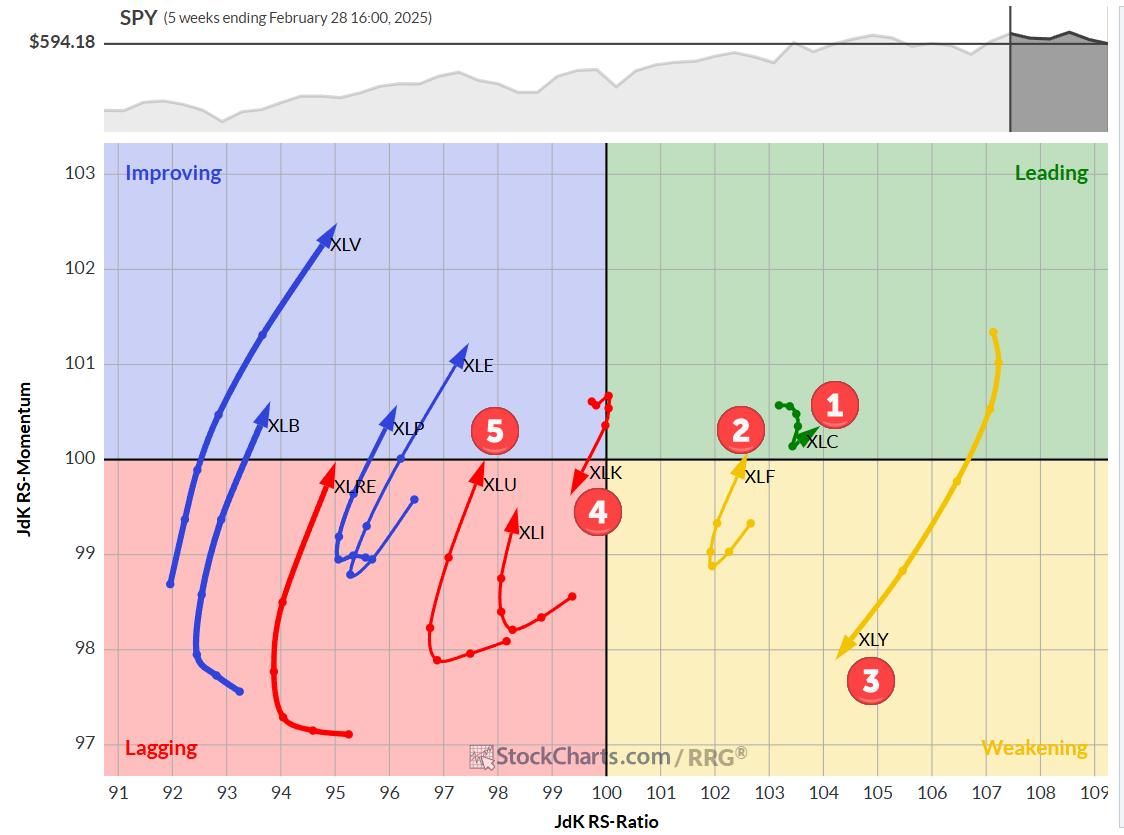
The Best Five Sectors, #10
Sector Shake-Up: Defensive Moves and Tech's Tumble Last week's market volatility stirred up the sector rankings, with 6 out of 11 sectors changing positions. While the top three remain steady, we see a clear rotation from cyclical to more defensive sectors Read More
Members Only
Martin Pring's Market Roundup1mo ago
Up Now, Down Later?
The Hysteria Last week I saw more references to the stock market and its sharp drop on cable TV than I can ever recall. Normally, as Humphrey Neil, the father of contrarian thinking put it, "When everyone thinks the same, everyone is usually wrong Read More
Trading Places with Tom Bowley1mo ago

Did Friday's Reversal Mark A Major Bottom?
The next step in the stock market will be very interesting. I've been discussing a potential Q1 correction since our MarketVision event the first week of January and it's here. The NASDAQ 100 ($NDX), from its high on February 19th (22222.61) to its low on Friday (19736 Read More
RRG Charts1mo ago
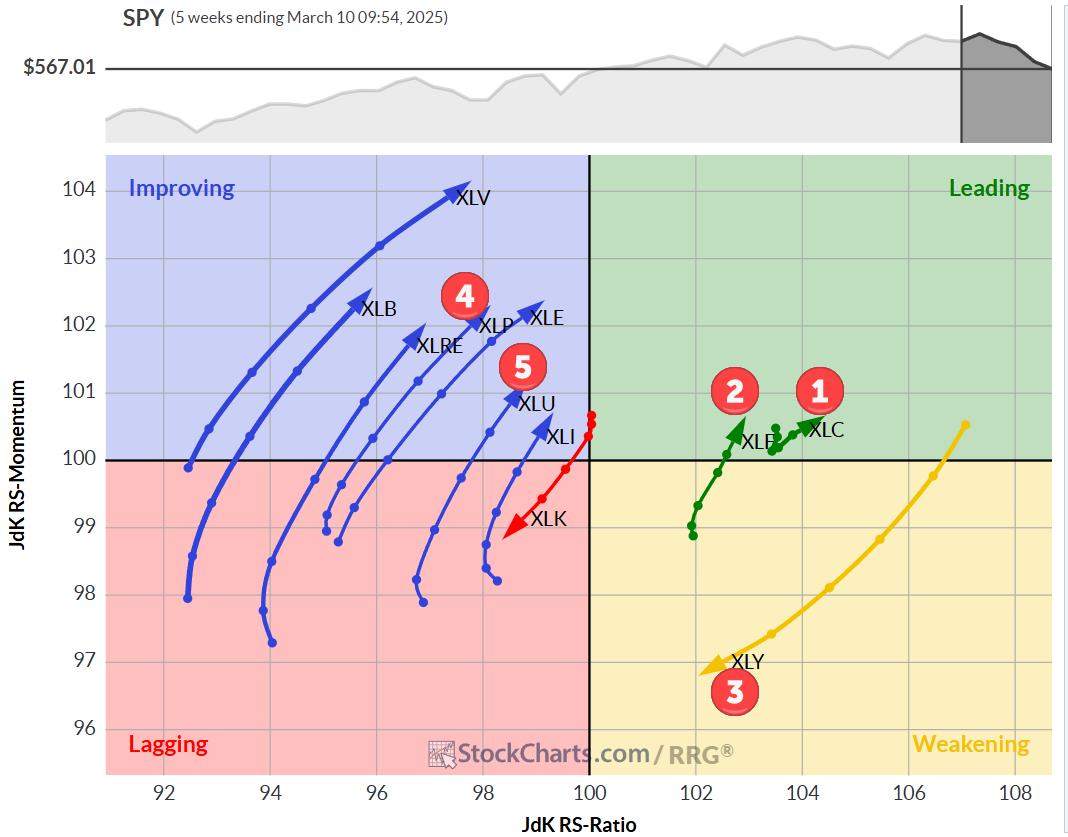
Sector Rotation Warning: More Downside Ahead for US Markets?
In this exclusive StockCharts video, Julius analyzes sector rotation in US markets, assessing recent damage and potential downside risks. He examines the Equal Weight RSP vs. Cap-Weighted SPX ratio and the stocks vs. bonds relationship to identify key market trends Read More
The Mindful Investor1mo ago

My Downside Target for the S&P 500
Things heated up this week on my daily market recap show, with support levels being busted without delay across the growth sectors Read More
Art's Charts1mo ago
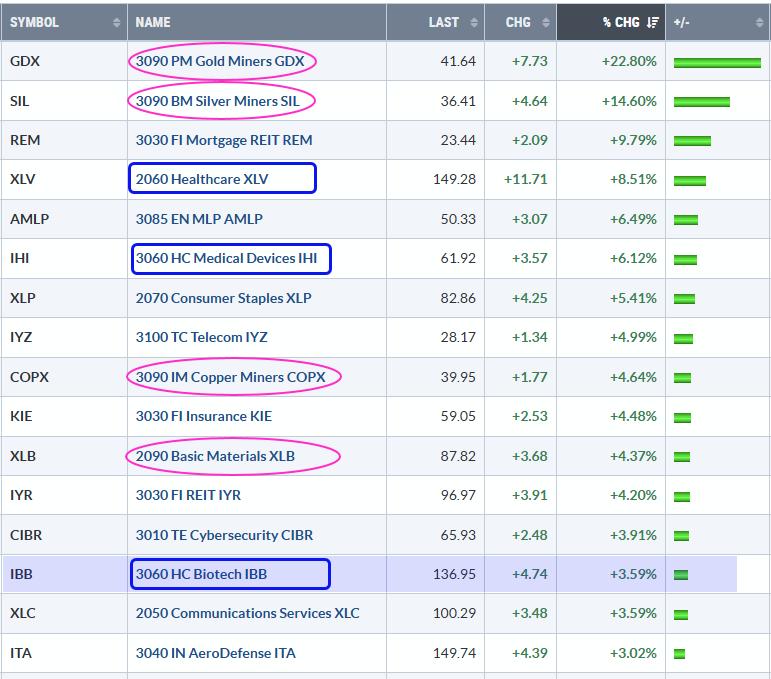
Commodity and Healthcare Related ETFs Lead in 2025 - Bullish Breakout in Biotechs
2025 is off to a rough start for stocks, but there are still some pockets of strength in the market. Year-to-date, SPY is down 1.73%, QQQ is down around 4% and the S&P SmallCap 600 SPDR (IJR) is down over 6% Read More
DecisionPoint1mo ago
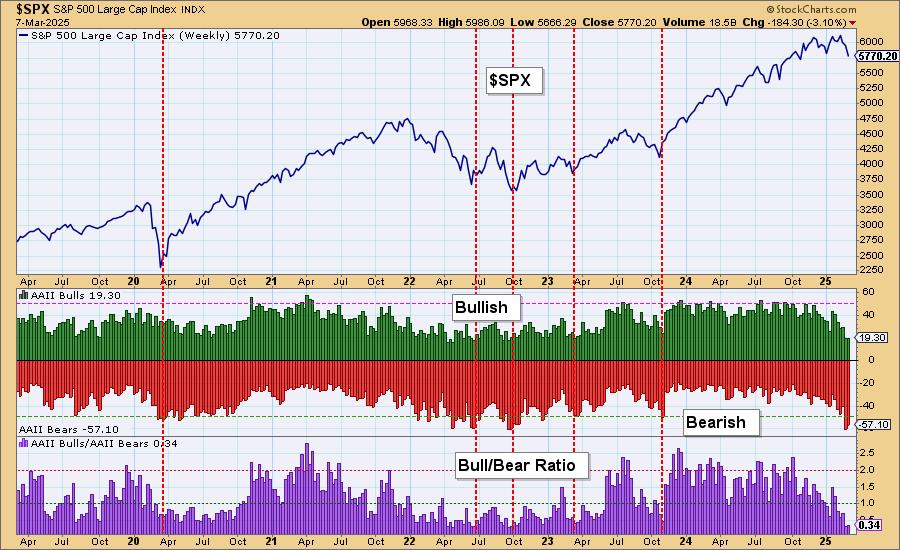
American Association of Individual Investors (AAII) Hitting Bearish Extremes
One thing to understand about sentiment measures is that they are contrarian. If investors are too bullish or too bearish, everyone has jumped on the bandwagon, and now it is time for the wheels to fall off Read More
Don't Ignore This Chart!1mo ago
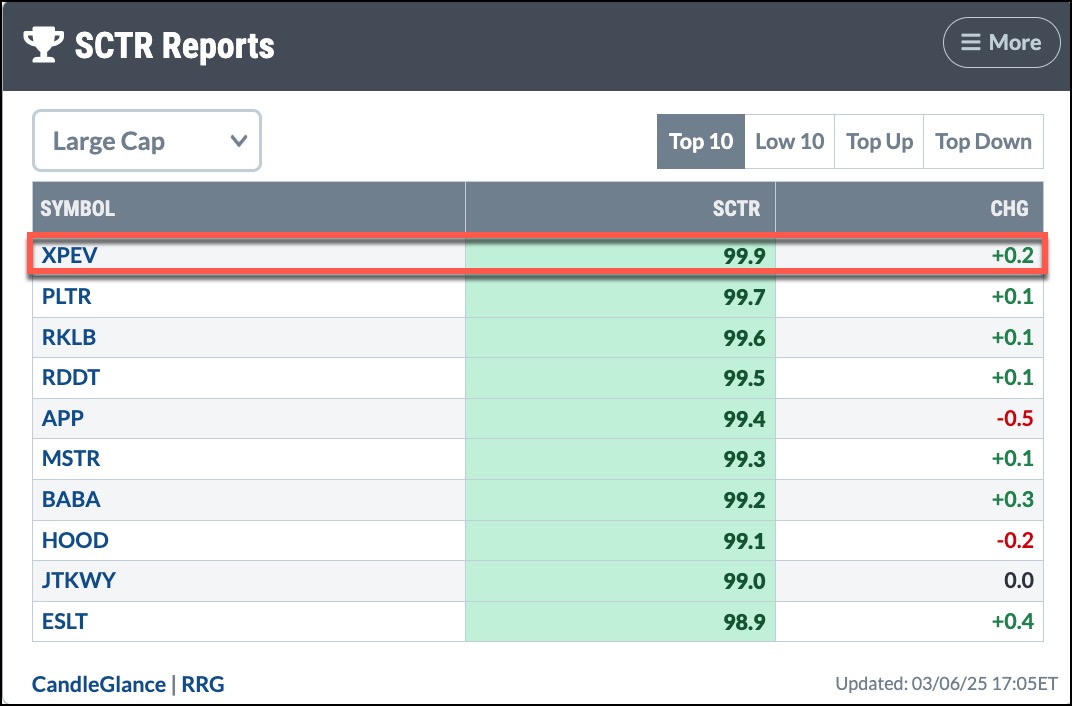
Why Investors Are Flocking to XPEV Stock: Decoding High SCTR Scores
And, the Oscar, er, top StockCharts Technical Rank (SCTR) goes to XPeng, Inc. (XPEV), a Chinese smart electric vehicle (EV) manufacturer. XPEV has silently crept its way to the top of the list. The Chinese EV industry has seen increased sales in the last month Read More
ChartWatchers1mo ago

Market Movers in Action: How to Identify High-Probability Dip-Buying Setups
If the essence of stock investing is to buy low and sell high, then buying not just low, but at a steep discount, optimizes your potential returns. This strategy is what's popularly called "buying the dip Read More
Stock Talk with Joe Rabil1mo ago

Simple Approach to Transform Your Trading
In this exclusive StockCharts video, Joe breaks down his trading strategy using multiple timeframes. He explains how to spot key patterns on higher timeframes and use lower timeframes for confirmation Read More
ChartWatchers1mo ago
Elevate Your Options Trading!
Follow along with this must-see video, where Tony will show you how to use the tools in the OptionsPlay Add-on to help find winning trades with just a few clicks Read More
ChartWatchers1mo ago

Navigating Tariffs: Master the Charts to Outsmart Market Volatility
Tariffs have thrown the stock market into dizzying moves, moving up and/or down based on whatever news headlines circulate. The broader stock market indexes have all declined, although they are holding on to their 200-day simple moving average (SMA) Read More
Add-on Subscribers
OptionsPlay with Tony Zhang1mo ago
How to Apply Top Options Strategies with the OptionsPlay Add-On
In this must-see video, Tony explains the top options strategies and shares the best practices for trade entries, exits, and optimal deployment conditions. As you watch along, you'll get a clear roadmap for confidently utilizing each option strategy Read More
ChartWatchers1mo ago
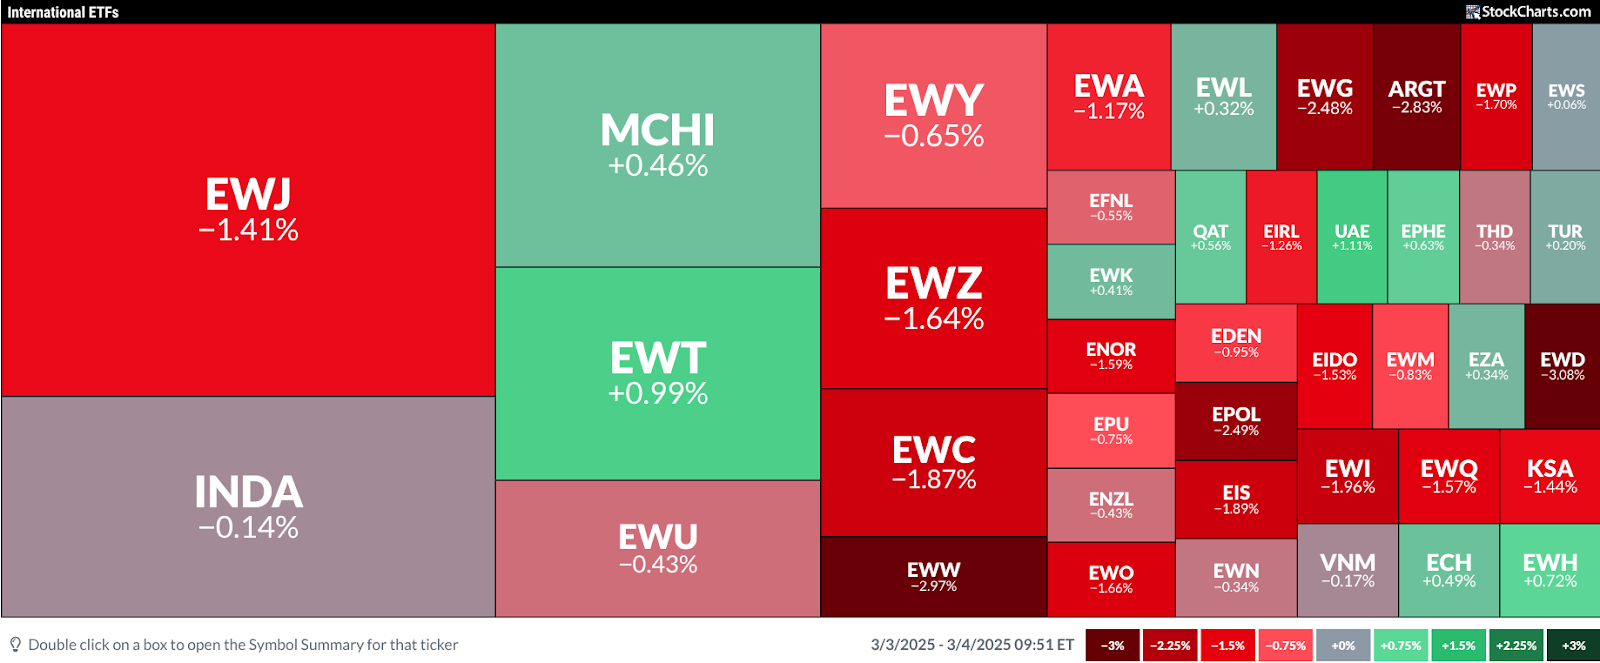
Trade War Panic: Are International Stocks the Safer Bet Now?
With US tariffs on Canada, Mexico, and China having taken effect at midnight on Tuesday, US indexes extended their Monday losses, deepening concerns over the escalating trade war Read More
The Mindful Investor1mo ago

S&P 500 Selloff: Bearish Rotation & Key Downside Targets!
In this video, Dave analyzes market conditions, bearish divergences, and leadership rotation in recent weeks Read More
Members Only
Martin Pring's Market Roundup1mo ago
Bitcoin Faces Important Technical Test
Over the weekend, Donald Trump declared the creation of a U.S. strategic crypto reserve, which will include Bitcoin and four other cryptocurrencies Read More
DecisionPoint1mo ago

DP Trading Room: Bitcoin Surges!
The news is that the United States will have a Cryptocurrency reserve. How this will occur is still murky, but Bitcoin surged on the news. Carl and Erin give you their opinion on Bitcoin's chart setup and possible future movement Read More
RRG Charts1mo ago
The Best Five Sectors, #9
Sector Rotation: Financials Climb as Consumer Discretionary Slips While the players in the top five sectors have remained the same, we can see some movement in their relative positions Read More
Trading Places with Tom Bowley1mo ago
Financials' Strong Week Lifts Them to Within a Whisker of an All-Time High
Many are watching the disaster in growth stocks unfold, including us at EarningsBeats.com, but the reality is that many other areas of the stock market represent a silver lining. When growth stocks sell off, essentially two things can happen Read More
The MEM Edge1mo ago

Growth Stocks Tumbling; Where to Find Safe Havens Now!
Growth stocks just took a sharp hit—what does it mean for the market? In this video, Mary Ellen breaks down the impact, reveals why NVDA could soar higher, and highlights safer stocks with strong upside potential! This video originally premiered February 28, 2025 Read More
The Mindful Investor1mo ago

3 Compelling Charts in the Financial Sector
In my recent podcast interview with Jay Woods of Freedom Capital Markets, we discussed and debated the evolving landscape for equities and other risk assets Read More
DecisionPoint1mo ago

New Indicator for Your Toolbox
As part of our regular market review in the DP Alert, we have begun to notice a very good indicator to determine market weakness and strength. It may not be new to all of you, but we've found as of late that this indicator tells a story Read More
RRG Charts1mo ago

Sector Rotation & Seasonality: What's Driving the Market Now?"
In this exclusive StockCharts video, Julius analyzes seasonality for U.S. sectors and aligns it with current sector rotation. He explores how these trends impact the market (SPY) and shares insights on potential movements using RRG analysis Read More
Art's Charts1mo ago

Small-caps Trigger Bearish, but Large-caps Hold Uptrend and Present an Opportunity
The Russell 2000 ETF triggered a bearish trend signal this week and continues to underperform S&P 500 SPDR, which remains with a bullish trend signal. Today's report shows the Keltner Channel signals in each Read More
Don't Ignore This Chart!1mo ago

Bristol Myers Squibb's Rising SCTR Score: Seize the Moment to Invest?
Bristol Myers Squibb (BMY) reported strong Q4 earnings earlier in February, and prospects remain strong for 2025, although it may face some headwinds Read More
Don't Ignore This Chart!1mo ago

Retail is at a Crossroads—Buy Now or Stay Away?
As "economic softening" increasingly emerges as the prevailing narrative driving the markets, the retail sector occupies a peculiar space amid these shifts in investor confidence, inflation fears, and looming tariff woes Read More
Stock Talk with Joe Rabil1mo ago
Hidden MACD SIGNAL? Key Trade Signals Explained!
In this exclusive StockCharts video, Joe breaks down reverse divergences (hidden divergence), key upside & downside signals, and how to use ADX and Moving Averages for better trades! Plus, he examines market trends and viewer symbol requests! This video was originally published o Read More
ChartWatchers1mo ago

Sector Rotation: How to Spot It Early Using Four Tools
Sector rotation is difficult to spot in real time because it unfolds over weeks or months and isn't always obvious until after the fact. Since there's no single or definitive way to monitor a rotation, you'd have to observe it from different angles Read More
The Mindful Investor1mo ago
Bearish Signals & Risk Management: Protect Your Portfolio!
In this video, Dave breaks down bearish macro signals and risk management using the "line in the sand" technique! Learn how to spot key support levels, set alerts on StockCharts, and protect your portfolio! This video originally premiered on February 26, 2025 Read More
Popular Articles

The Bottom is Here or Rapidly Approaching

Investors on the Move: A Visual Guide to the Stock Market

Bullish Percent Index Confirms Short-Term Rebound

An Oversold Bounce is One Thing - A Bullish Breadth Thrust is Another

This Report Might Self Destruct in 5 Days

200-Day Moving Average Confirms Bearish Phase
Get expert technical commentary delivered straight to your inbox! Sign up for our FREE weekly ChartWatchers Newsletter. Learn More
Featured Authors


Public ChartList Leaders


StockCharts Members unlock complete access to the Stocks & Commodities Magazine archives. Read the latest articles or browse past editions.