This is a long but important blog. It clearly illustrates why this point in time is so important. What Point?
How price behaves at this 200 DMA.
How the 50 DMA reacts right now.
What do we need to see to confirm the move higher.
Introduction
One of the major traits of a bear market is the whipsaw of emotions that one experiences when in a bear market. Gut wrenching drops with sizzling rallies. The market rallies on bad news, it rallies on good news, it falls on good news, it falls on bad news. It seems almost chaotic. Well here we stand with all of those emotions in play within a few weeks.
One of the major things I try to remember is to try to zoom out to the pig picture. I went back and marked up the charts on the bull and bear markets from 1999 to 2011 to get some scope.
I want to show some of the common setups over the last 10 years.
Just using basic RSI readings to keep this simple.Three Phases only :
Bull market RSI between 40- 90,
Bear market caution is an RSI between 34 and 39,
Bear Market signal is an RSI 33 or below.
In other words:
When the market oscillates between an RSI of 40 to 95, its a bull market.
When the market oscillates lower than 40, say down to 34, it is a bear market caution.
When the market reaches an RSI in the low thirties, like 30,31,32,33 it is a bear market signal.
At this point the RSI is usually stopped below 68,67,66,65 to continue a bear market. Should it proceed to the top, we would call an end to the bear market and a subsequent start of a normal or bull market.
Three Phases only : Bull market(also shown as a bear market cancelled), Bear market caution, Bear Market signal
______________________________________________________________________________________
For the purpose of this analysis, we will not be discussing the Red, green arrows nor the blue vertical lines. So you understand what they mark, I have listed it here. I just don't want to produce multiple charts!
The arrows on the chart have two meanings:
1) indicate start of swings that went through to the other side or almost the other side of the Bollinger Bands (BB). So a move of multiple standard deviations in a short time. It seems to work.
2) Or, it indicates the high or the low for the quarter.
3) The dotted vertical lines represent Options expiration dates.
________________________________________________________________________________
I'll comment at the top for each chart below. Remember, you can click on each chart to open a bigger version.
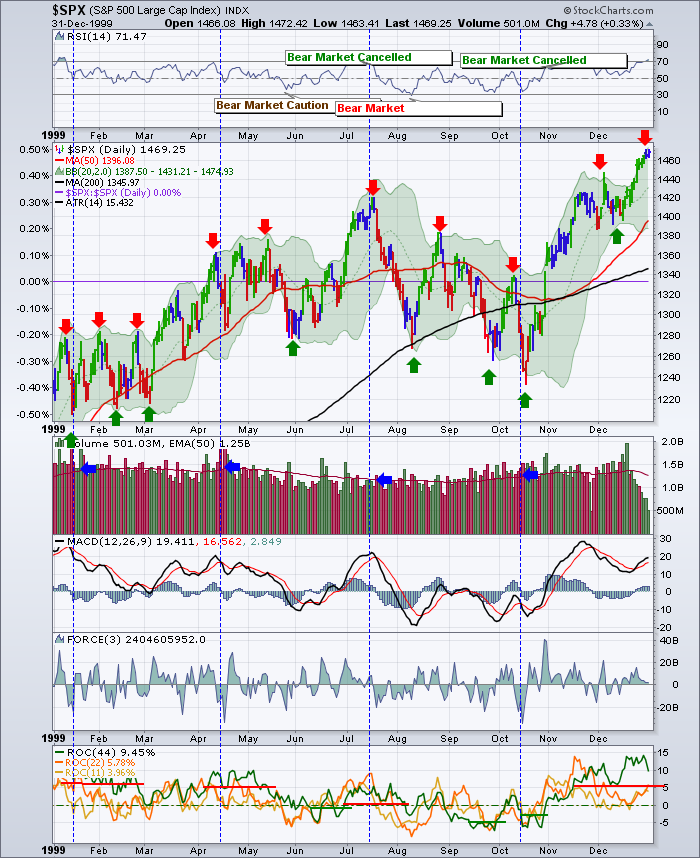
Here is 1999
The RSI swung wildly from high to low, Touching Overbought and oversold throughout the year. 50 DMA and the 200 DMA are both sloping up. Primary Bull. 200 DMA is rising. This year is just a reference year to get you started in an uptrend.
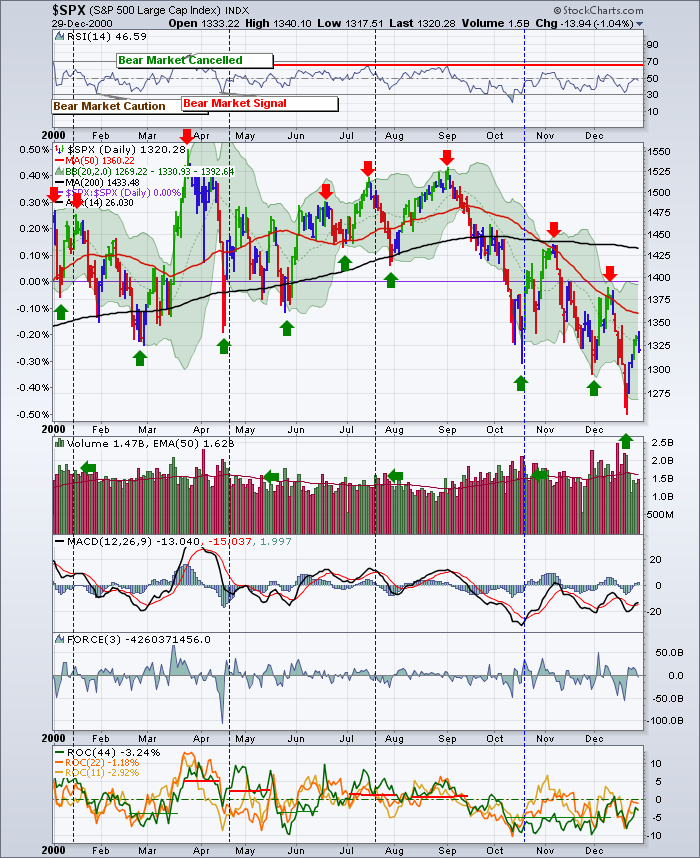
2000 the famous market top for the tech bubble.
Notice the warning in Late January after the Champagne filled new years Eve.
It was cancelled with a high RSI reading of 70.
April 2000, we received a Bear market signal. Despite the furious rallies, the RSI could not make it to new high ground. Note the megaphone pattern between June and September! Yelling 'this is a TOP!'
The market is fast moving. It can cancel a bear market signal by going overbought. It was unable to do so for the rest of the year. More Importantly, the 200 DMA hadbeen upsloping, but started to roll over and turn down by October. Notice how the 50 DMA moves below the 200 DMA just as the 200 DMA went flat. That means the average for the 200 previous days was no gain. Sound familiar? Now we want to watch how the market responds during each rally.
Bear market rallies are valuable. You can make money buying early and selling early. Notice how ripping the rallies were. Bear market rallies are the quickest rallies - sound familiar?
Let's watch how the 200 DMA behaves and the price interaction with 50 dma.
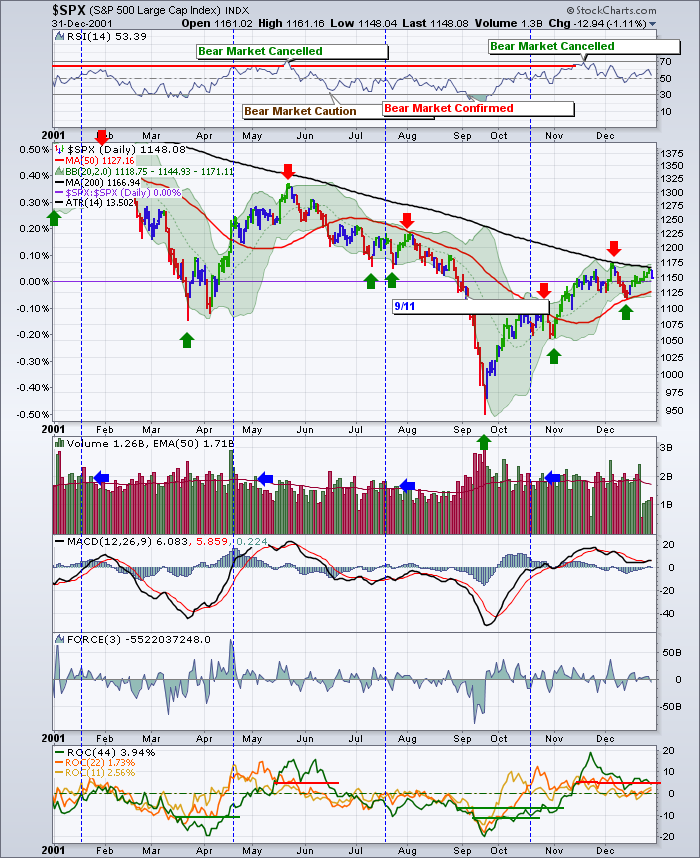
You can see we stayed in a bear market for most of the year. When the bear market is cancelled, you can see we moved back to bear market caution on the next pullback. Not good. Only when we got the bear market confirmed could we draw the red line back to the last 'Bear market Cancelled' in May.
Notice the 200 DMA, and how it was a ceiling for the index. Also notice that the 50 DMA had trouble going higher. The 50 DMA had brief upturns but maintained a negative slope for most of the year and resided the entire year below the 200 DMA.
Even 9/11 just exacerbated the downtrend it was already in. The 9/11 bounce actually cancelled the bear market signal at it's peak.
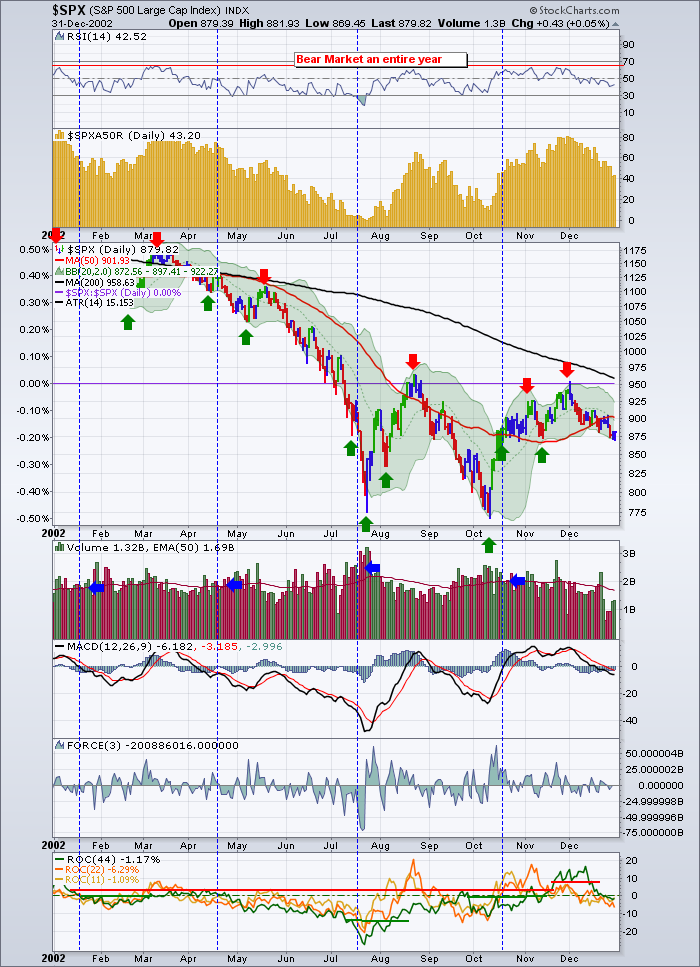
lets go to 2002.
Well we resumed a bear market from the 9/11 bounce and it continued through an entire year. Notice the speed of the rallies, but the RSI was not fooled once. Hidden behind the lettering in the top left, the price went above the 200 DMA for a couple of weeks. That pulled the 50 MA up, but not above the 200 DMA.
Both MA's stayed in alignment with the 50 below the 200 DMA.
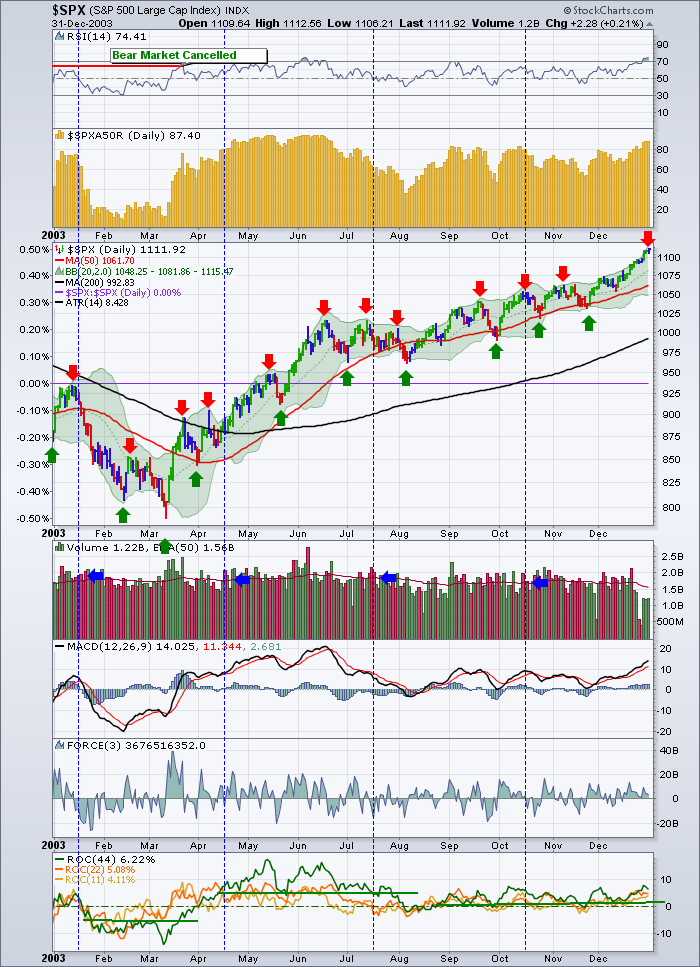
In 2003 we got a Bear market rally that finally broke through the RSI 70. Notice how the RSI stayed above 40 for the entire year. Notice the 50 moving above the 200 DMA long after the confirmed bull market by the RSI. By now, you are racing to the 2011 chart, but I'll continue!
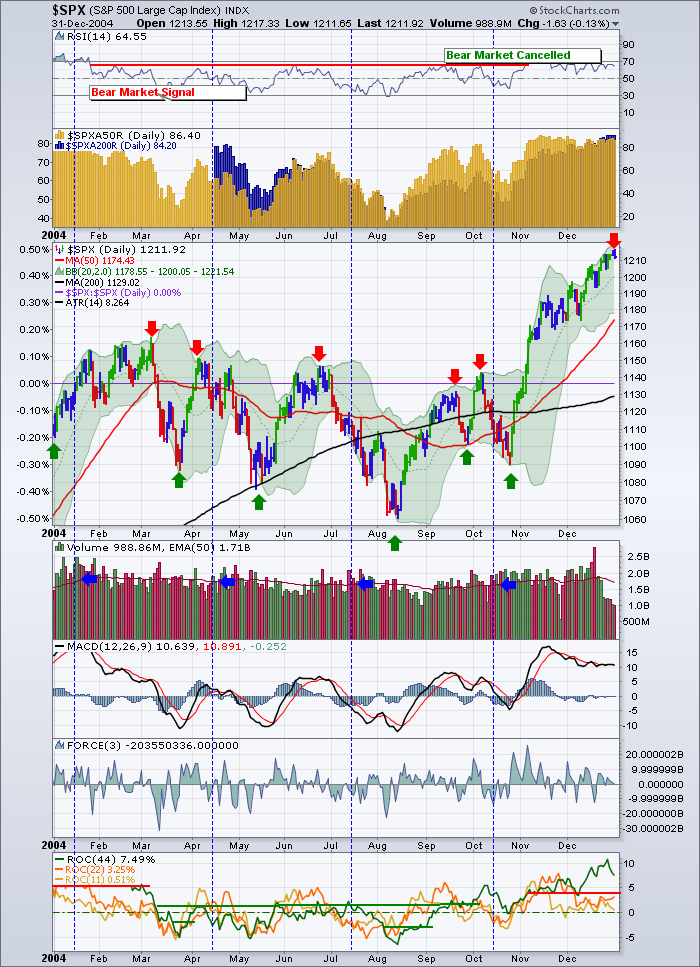
The Rally of 2004 was an interesting one. After a great bull market rush that started in March of 2003 it had some work to do to continue. Notice the start of a bear market. Got the signal in March and it made for a tough season. Very choppy, oscillating up and down. The 50 DMA crossed below the 200 DMA. The dark cross, oh no! But true in all bear markets, a rally from oversold is awe inspiring. It rifled higher much like 2011. Sound Familiar? It broke previous resistance at 1150. Which amazingly is not too far from where we reside now in the SPX at 1218. It went on to cancel the bear market in Early November and the uptrend was underway. The Golden cross (50 moving above the 200 DMA) confirmed the move. Notice the slope of the 200 DMA was in question in late October, but turned up soon after to resume it's climb.
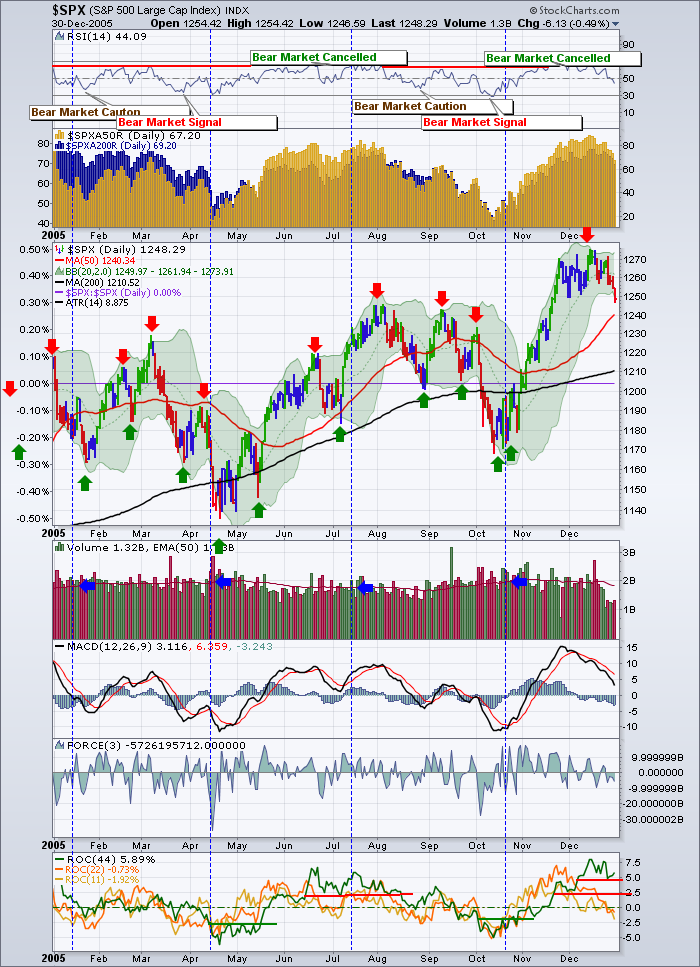
2005 was just about a holiday for Portfolio managers. Up, Up and away.
Well, I'm joking with you to see if you are still following these market swings. 2005 was hard work.
2 bull market signals, 2 cautions, 2 bear market signals. It was a wild one. But a nice move up in the fall.
The 200 DMA maintained a positive slope almost all year. A 2 week exception once again going flat in October. The 50 DMA never got below the 200 DMA.
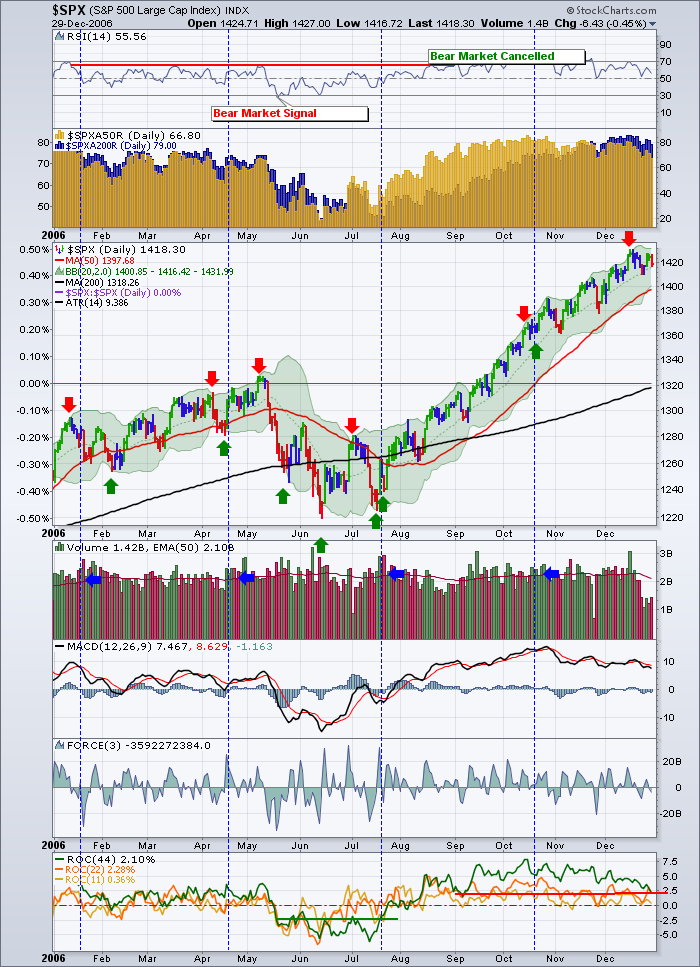
2006 was a remarkable year. It went from a strong bull market, right to a bear market signal. Ouch. Caught even the best technicians off guard. The rally off the lows was impressive. The market climbed steadily and cancelled the bear market signal. Bull market mode. Stayed there for the later 1/3 of the year. Notice the 200 DMA maintained positive slope, and the 50 crossed down briefly only to pop right back up!
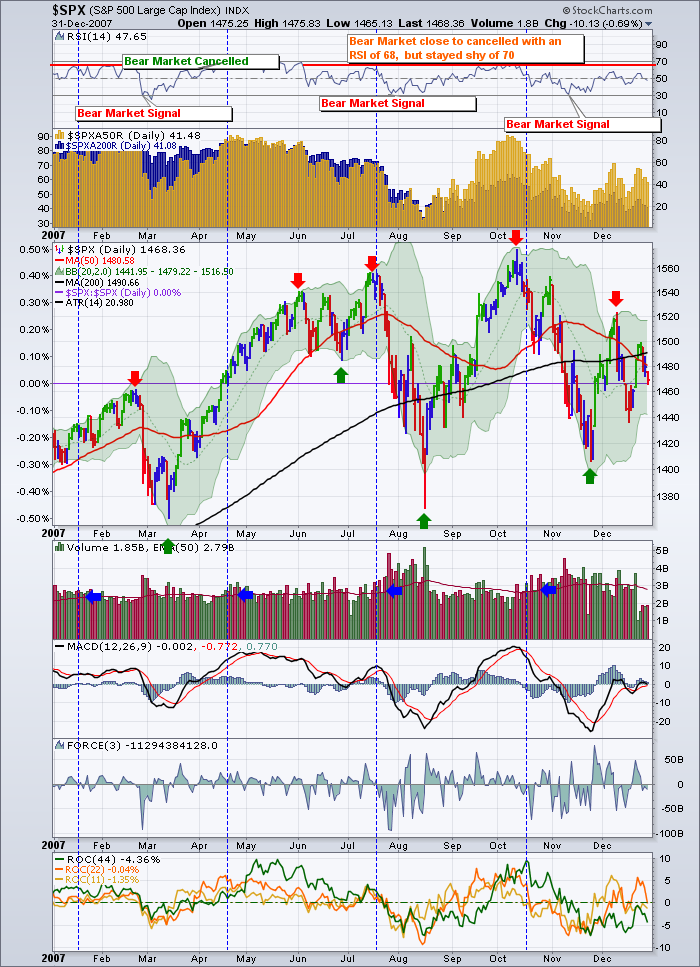
2007 Was the year of the Sub Prime Crisis that started in 2005, 2006. Nothing is instantaneous! Imagine waiting for the imminent fall for years! Painful...
Well, 2007 generated its share of signals. On the October 9th high, the RSI was 68. So technically it didn't cancel the bear signal of August. But it was way up there so I coded it orange. Notice the 200 DMA maintains its positive slope all year and the 50 lurches below it while everyone is on Christmas holidays.
Notice how the price tests the bottom side of the 200 DMA and fails between Christmas and New Years... and the 200 DMA was sloping up at the time of the test. So it could easily have soared on to new highs and all would be forgotten. That was a significant test level.
Three things made it important. The 50 had recently crossed below the 200 DMA. The upslope on the 200 was still intact. The price had dipped below the 200 DMA multiple times before. It failed in a few days of the test.
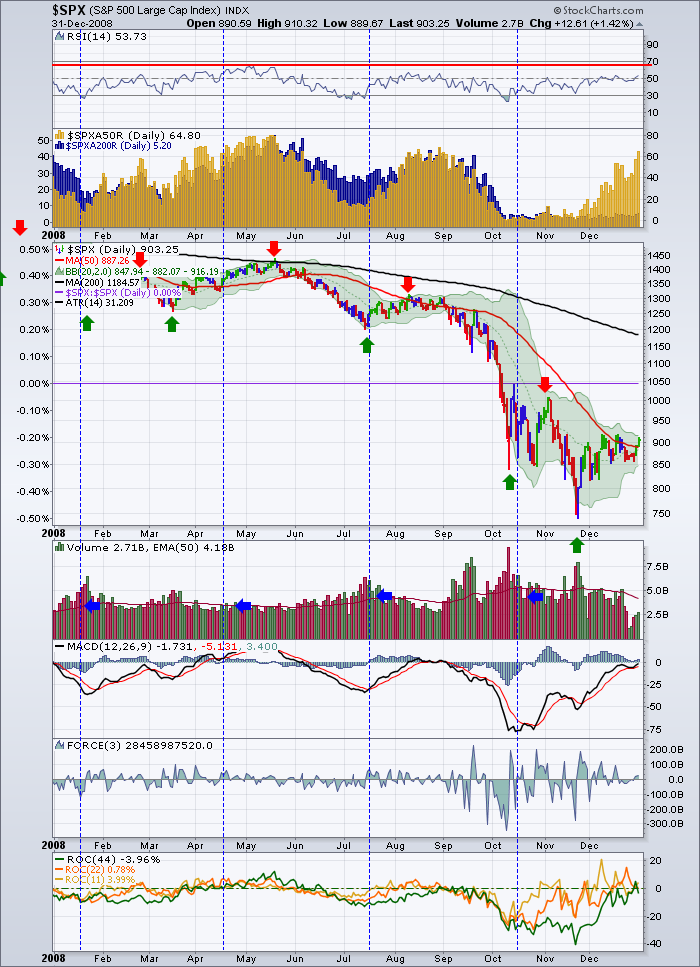
2008 was a bear market. It started with a signal in November 2007 and never relented all year. The SPX price traded below the 200 DMA all year. Every test of the 200 DMA was rejected within a few days. The 50 DMA is tracking below the 200 DMA all year. The 200 DMA never develops a positive slope all year.
The Price traded below the 50 DMA for most of the year as well.
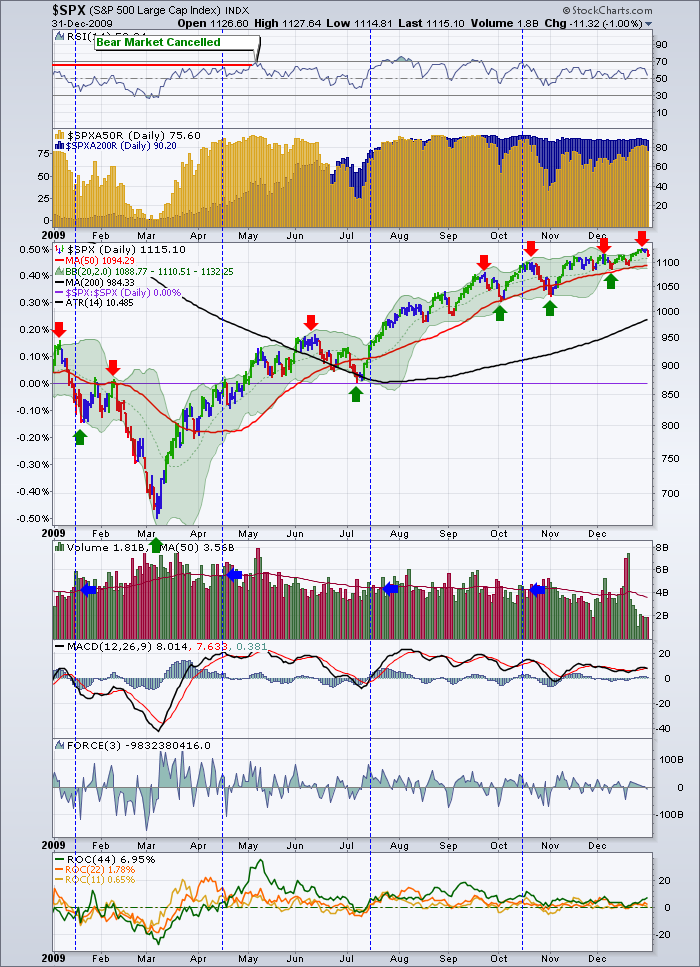
2009 was the reversal we all remember. Big push up off the bottom. The market rallied beautifully.
The 50 DMA crossed above the 200 DMA and all was good. This was a great rally. It gave us a confirmed bull market or 'cancelled bear market' May 2009.
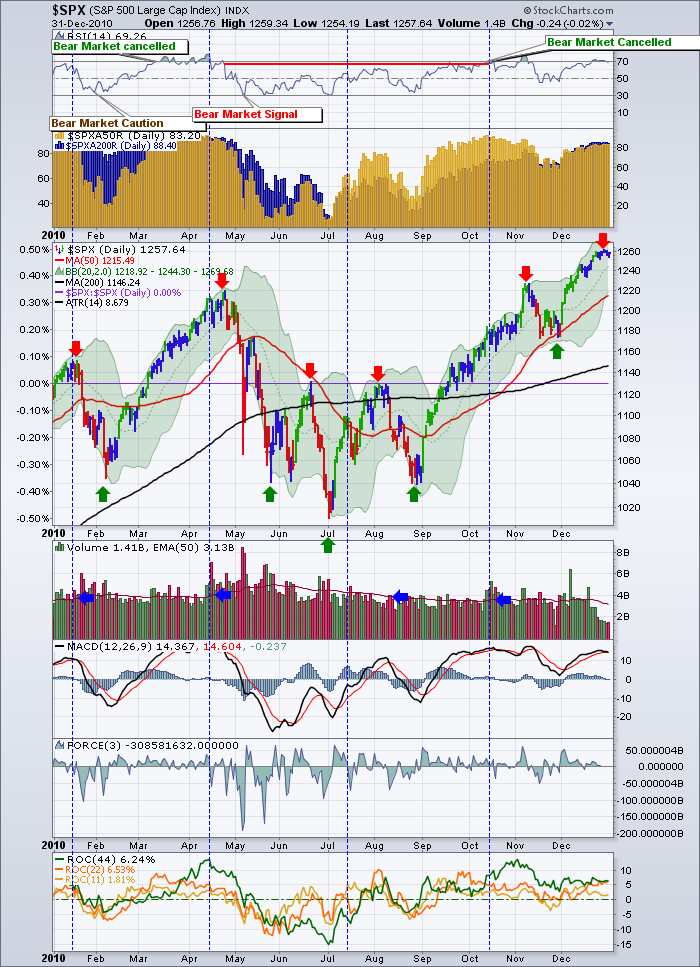
2010 was a year of hard work. The 200 DMA went flat twice in the middle of the year and had substantial pressure on it. The 50 DMA was pushed below the 200 DMA, settled, started turning up and raced through the golden cross of the 200 DMA. We were Bookended with Bull markets to start and end the year with a bear in the middle. A Bear Sandwich!
We exited the year with an upsloping 200 DMA.
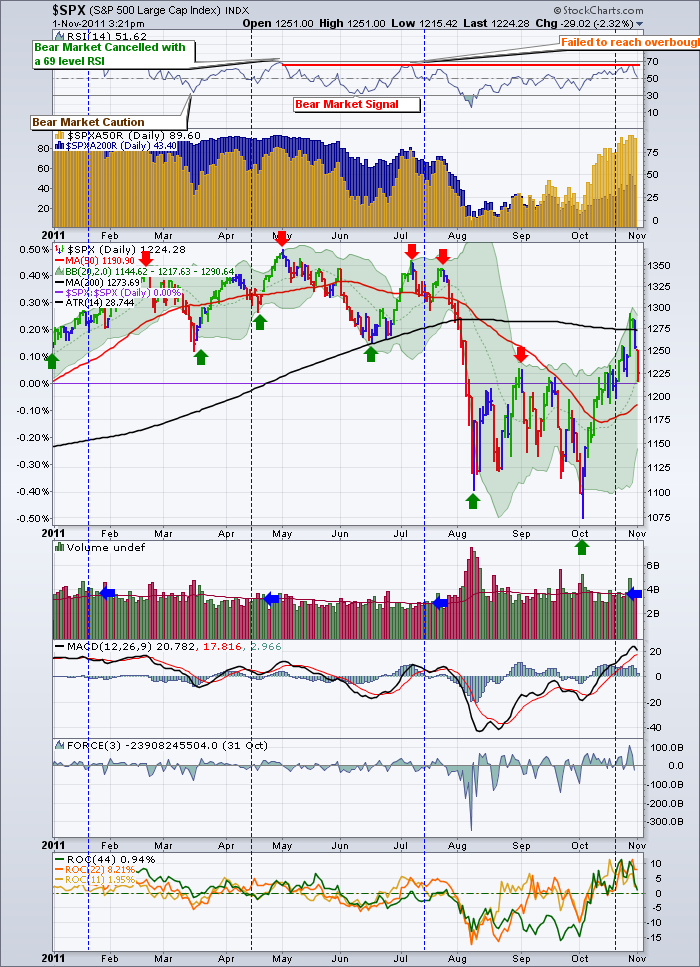
OK that brings us to 2011. Let's review where we are at.
The March 2011 pullback showed weakness in the RSI and gave us a bear market caution. While the RSI never reached overbought, it did reach 69. Then it went down to a very weak 33 RSI. Weaker top and a deeper bottom. Bear Market Signal. We still have to keep watching. These bear market rallies are swift and powerful. I would suggest the biggest issue we have is right here.
We have :
1) The 200 DMA has been downsloping for multiple months August, September and October. This sounds familiar with the 2001 top and the 2007 top. It does not sound like an interim top.
2) The 50 has moved below the 200 DMA. We would look for the price to break above the 200 DMA to change this position.
3) The Price has to move up above the 200 DMA and stay there to get the 50 DMA back above the 200 DMA. Should that fail, that would be significant as it is usually the last place to add protection on your portfolio.
4) Bear market rallies are powerful and profitable. But you may be more successful to take some profits when the RSI is above 60 in a downtrending 200 DMA. Obviously, three times in 11 years this will be wrong. A few times you will be too late as well.
5) Does this confirm the downtrend. Yes till the moment this is published. Then we have to watch the price action to see if it can reverse the downtrend and go higher. Currently it would appear that the price has failed to break and hold above the 200 DMA.
6) What is very important right here and now is to see if the price can get back above the 200 DMA in order to break this 'top of the hill' feeling the 200 DMA is giving us. If it can, then we want to see the 50 day give us the positive cross again. This will start to trend the averages up. We can all breath a sigh of relief when the 200 DMA starts to develop a positive slope.
This is a long but important blog. It clearly illustrates why this point in time is so important. We need the RSI to turn higher and cancel the bear market signal by returning to bull mode.
To Subscribe to the blog, you can follow this link and click on the top right corner.
MOST IMPORTANTLY!
Tom Bowley of InvestED Central out of Washington is coming to Calgary next week. He will be presenting Saturday November 5 from 9:00 AM till Noon, He will also be presenting Tuesday night from 6:30 till 9:00. Space is limited but let's pack the house! Same presentation both days!
Follow this link to the CSTA website.Register for FREE online on the Right hand side farther down the page.
www.CSTA.org (this link should now be working)
Good Trading,
Greg Schnell, CMT

