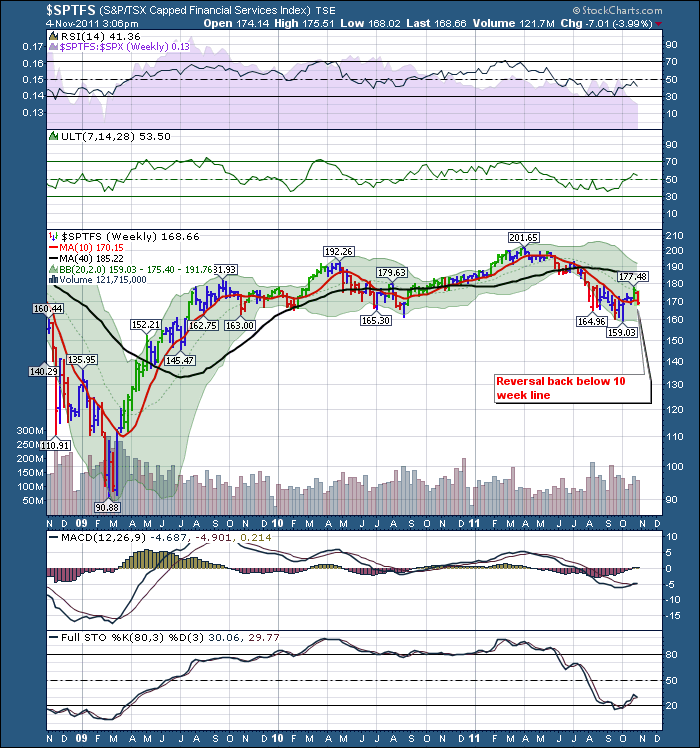
Here is the Bank Sector:
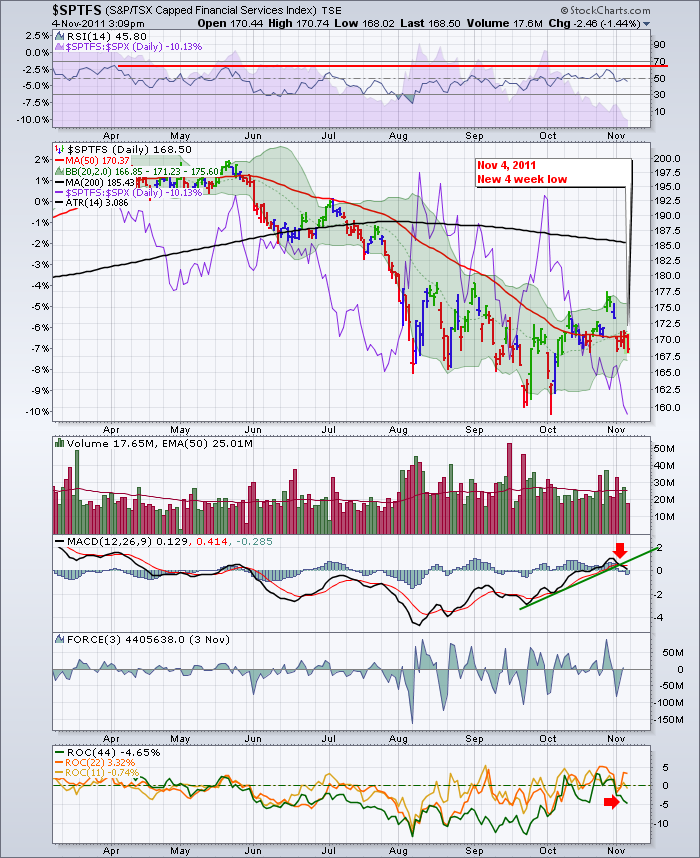
I don't like the red candle that made new 4 week lows this week. Here is the daily.
I am very surpirsed that the Canadian banks did not get a relief rally at all after the Monday / Tuesday drill down. Maybe we tested the lows today and held. But with Wednesday, Thursday being so strong and no real rally on this chart, I am increasingly worried that the financial markets are sniffing more trouble.
Lets do a quick look of the weekly and the daily for the Canadian 5 banks.
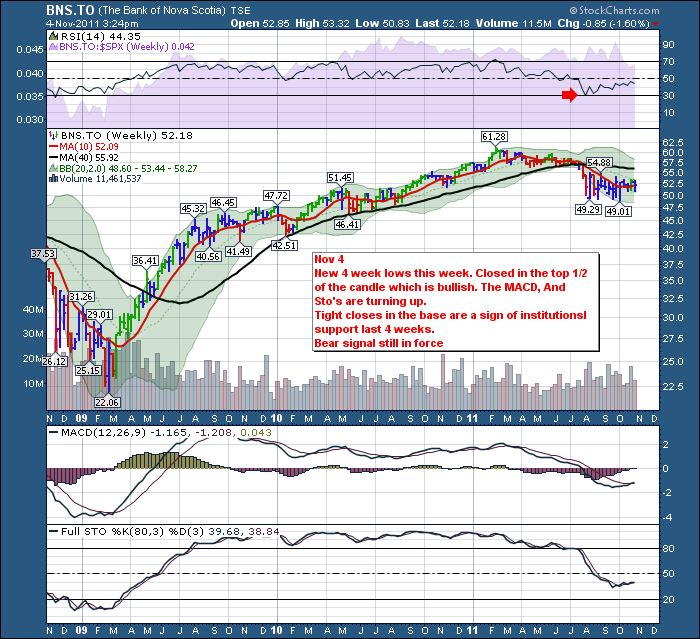
BNS
The 4 weeks with closes all between $52 and $53 is very Bullish.
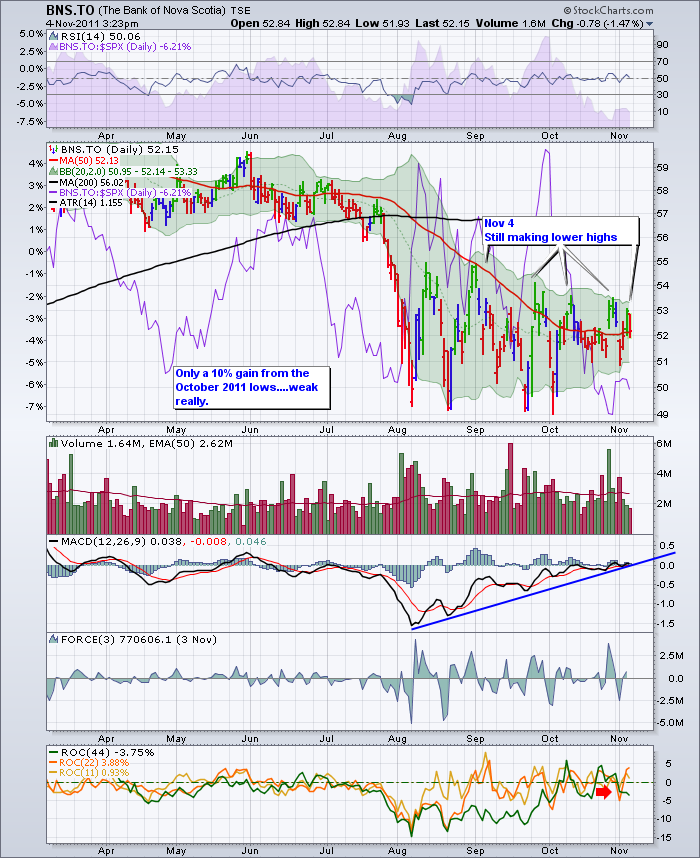
On the Daily, Look at these stretched candles.....
The daily is really in a decision zone. The ROC is all around the zero line. The Price is still making lower highs, but just barely. You can see the candle length is starting to shorten so the buying is firming up in this stock. You'll notice on the weekly, how strong this chart is.
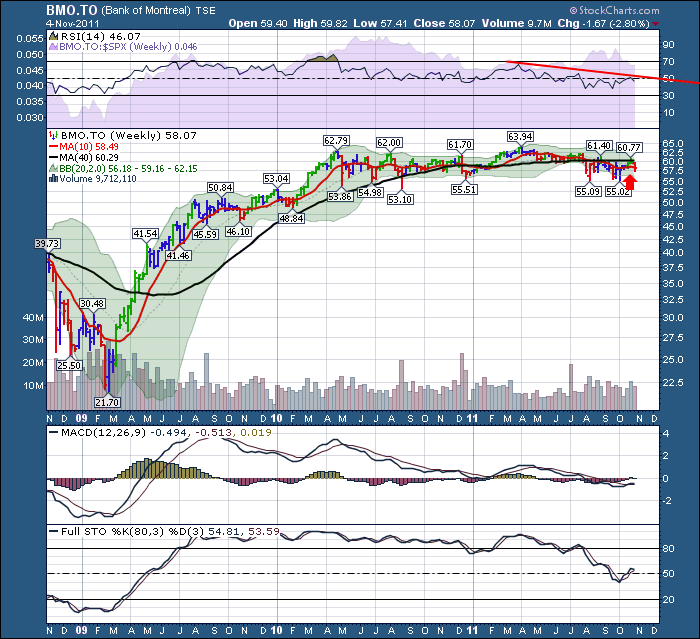
Here is BMO
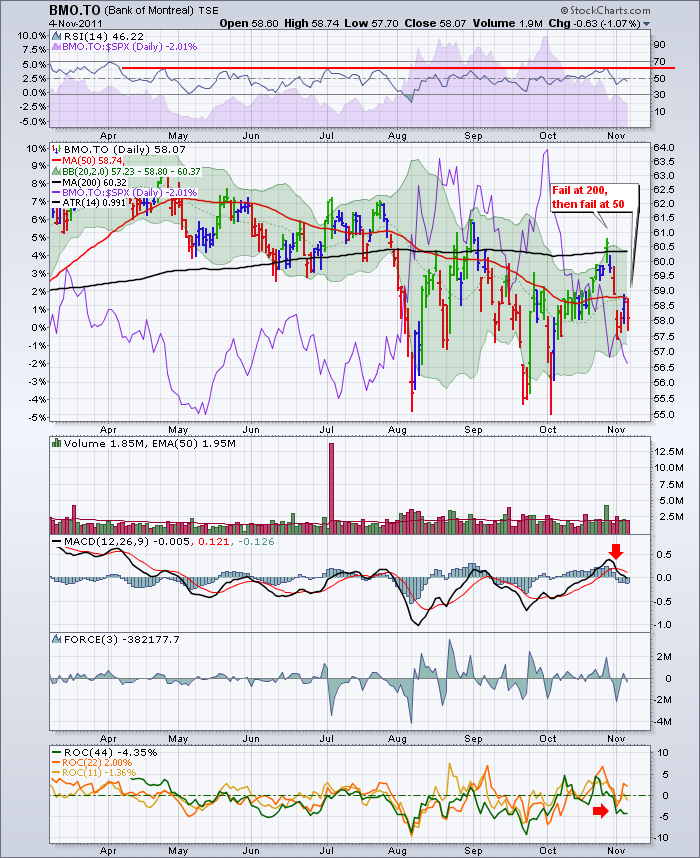
Last week it was looking pretty good. This week a red candle shows up. THis chart did not make 4 week lows. Here is the Daily. Failed at the 200 DMA test, and failed support at the 50 DMA. TOUGH WEEK!
These tight weeks are good, but its still not ticking up.
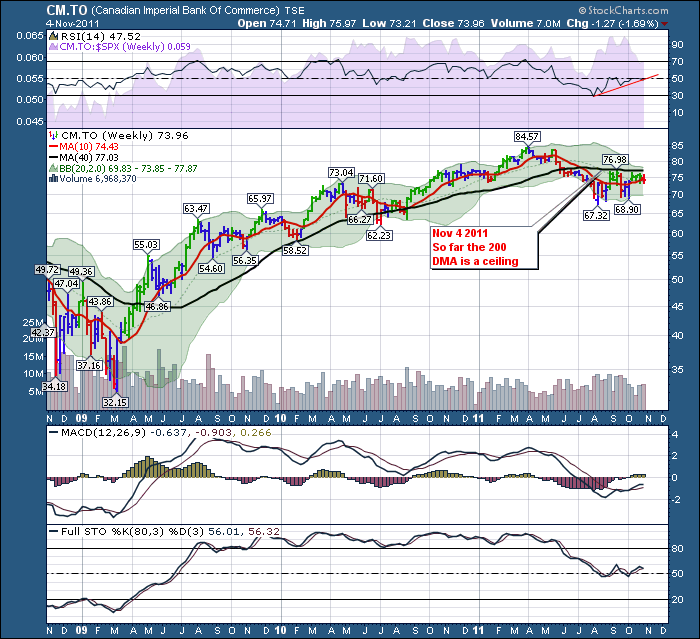
Here is CIBC.
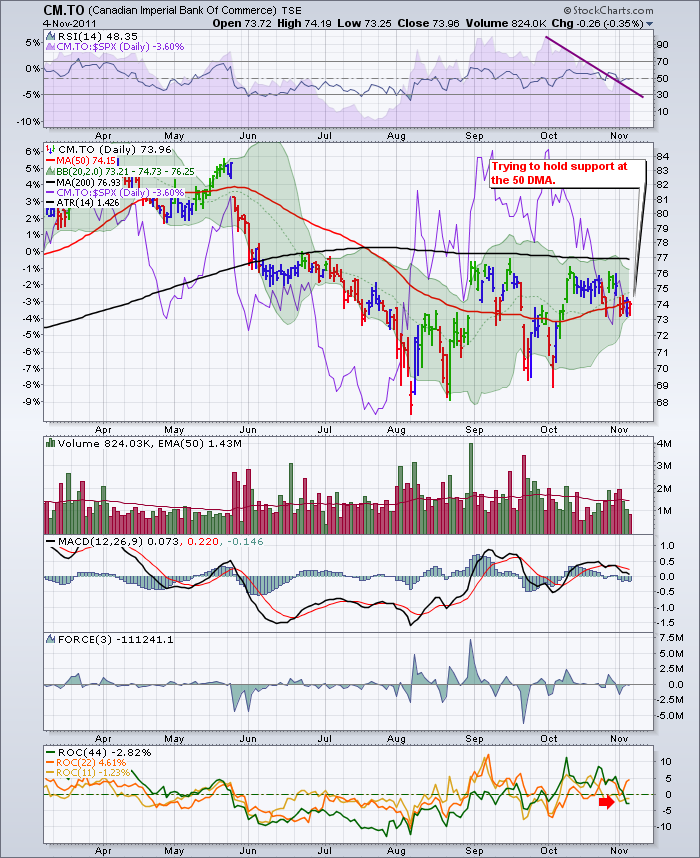
Here is the CIBC Daily.
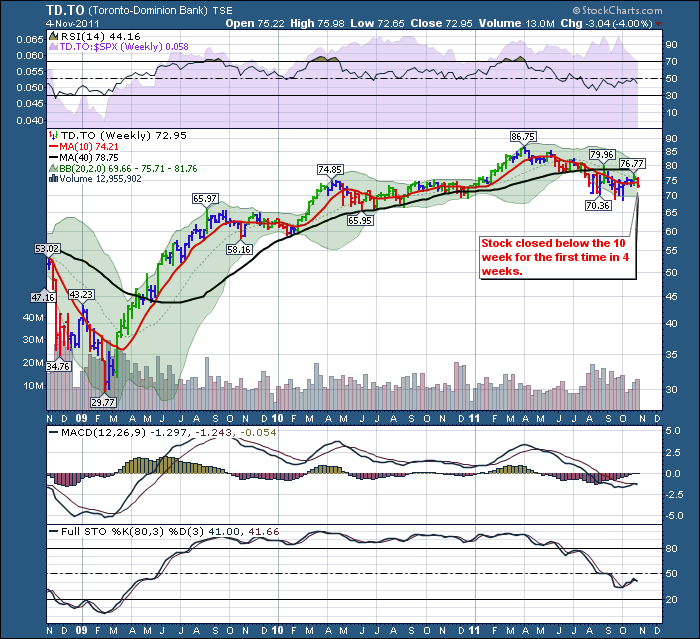
TD.TO
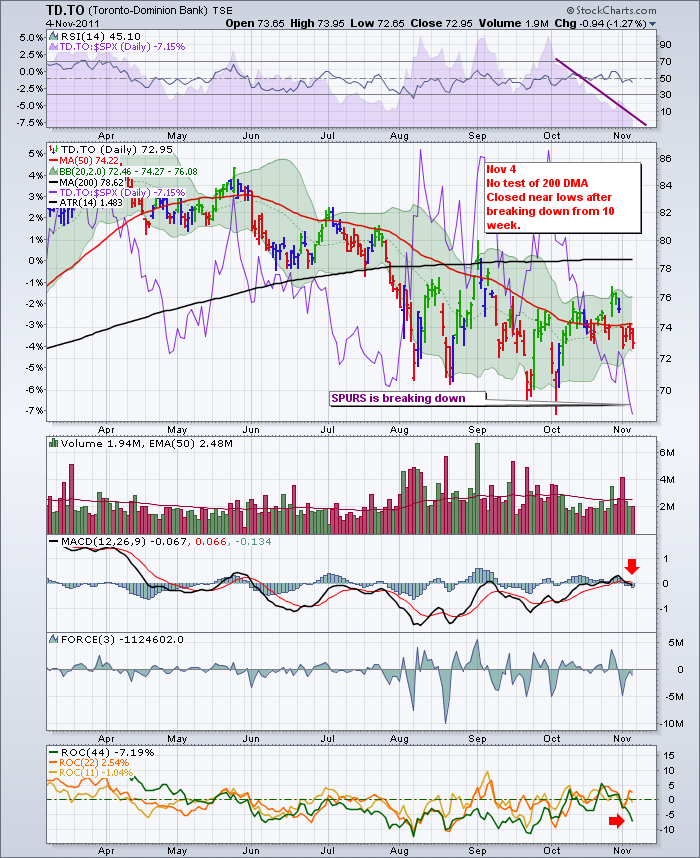
TD Daily.
TD Is really weak here. Breaking down, 3 week lows, closing near the bottom.
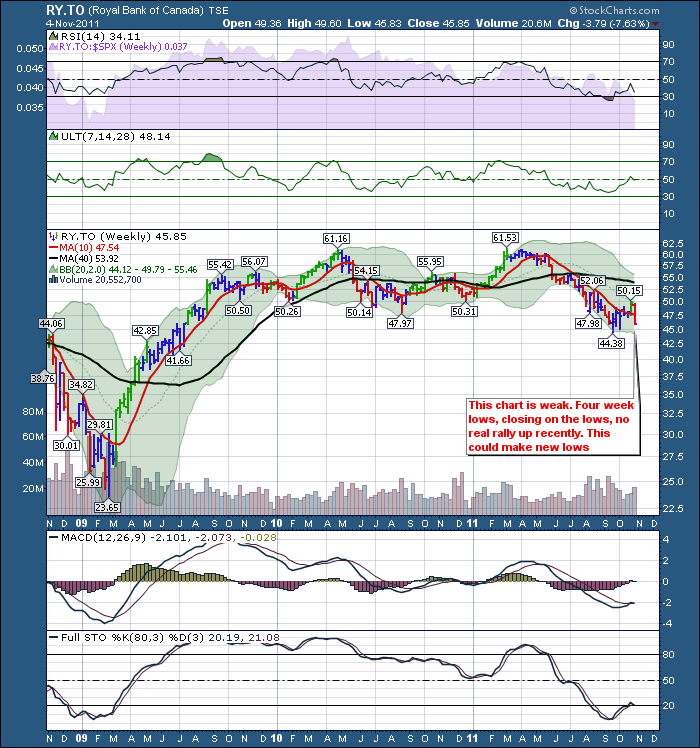
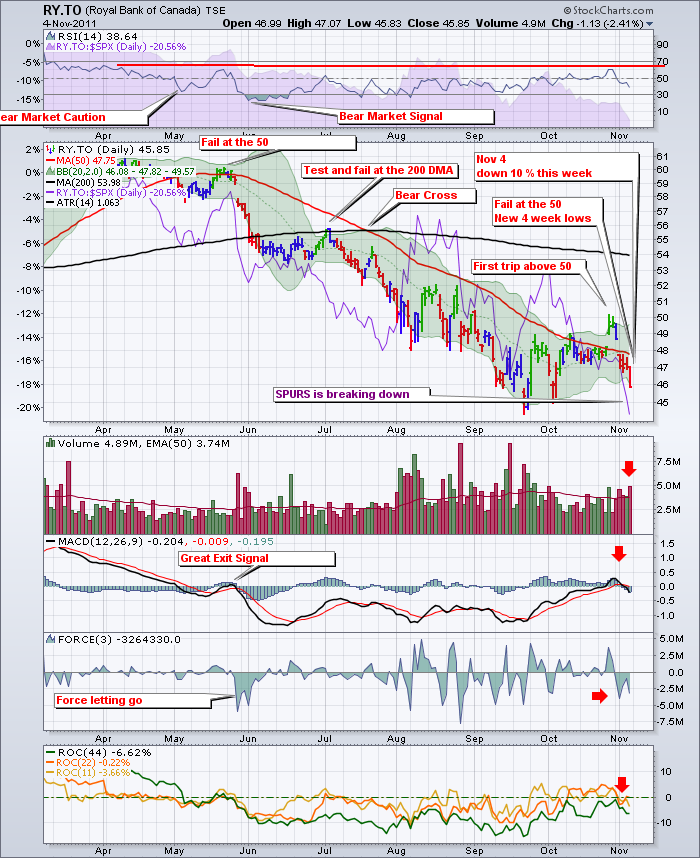
Finally here is Royal Bank.
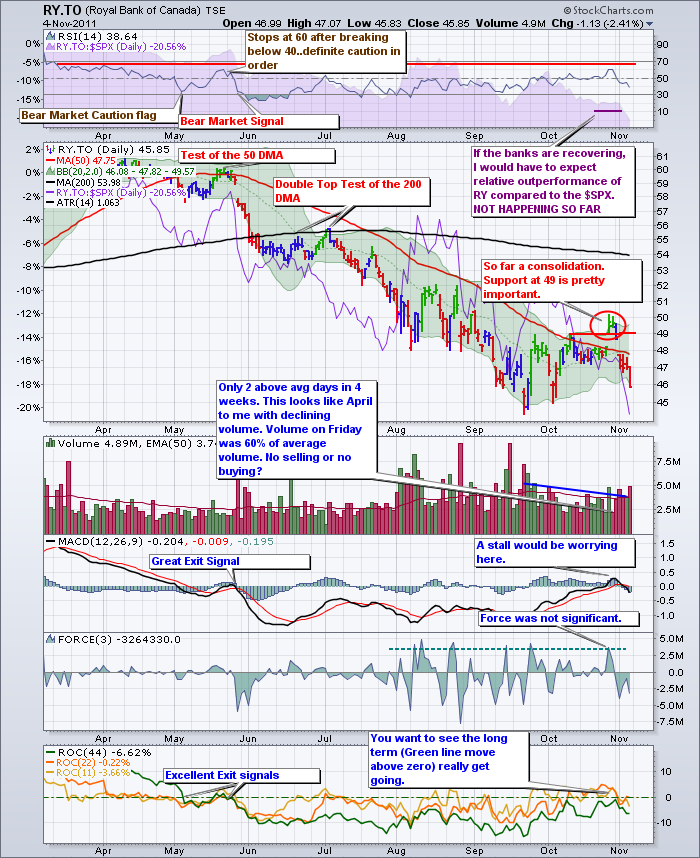
Royal Bank Daily... This chart was annotated a few days prior to the following one.
My current look at RY.TO is below. The weak chart above was annotated at the island high one week ago. It failed quickly. It dropped almost 10 % in a week even though major indexes were off only a little bit. So an Island reversal.
In Summary, the banks are weak. I am not convinced that Greece is a sideshow, but it is relative to Italy. The EU bond yields are creeping up to new highs after the efforts by the EU leaders to ring fence Greece problems. One level that is closely watched is 7% for Italy. Currently the bonds are at 6.39% and when the announcement was launched we were under 6%. Another 2 weeks at this pace would put us over 7% .Not a prediction, just a place to get very defensive.
If the Italian debt spirals out of control, they have 2.1 Trillion in debt. It is the third largest in the world! I am not predicting anything here, but why are these Canadian banks being avoided or sold? They are not world leaders but they are perceived to be relatively safe. To lose 8% this week after the EU rescue plan is worrying to me. Safe banks should show accumulation. I like the patterns in BNS. The rest not so much.
Europe also reported numbers that show the EU near or in recession.
If the banks can get a bid than I'll be more comforted. Can the $SPX get above the 200 DMA?
Stay tuned in.
To Subscribe to the blog, you can follow this link and click on the top right corner.
Regards,
Greg Schnell, CMT

