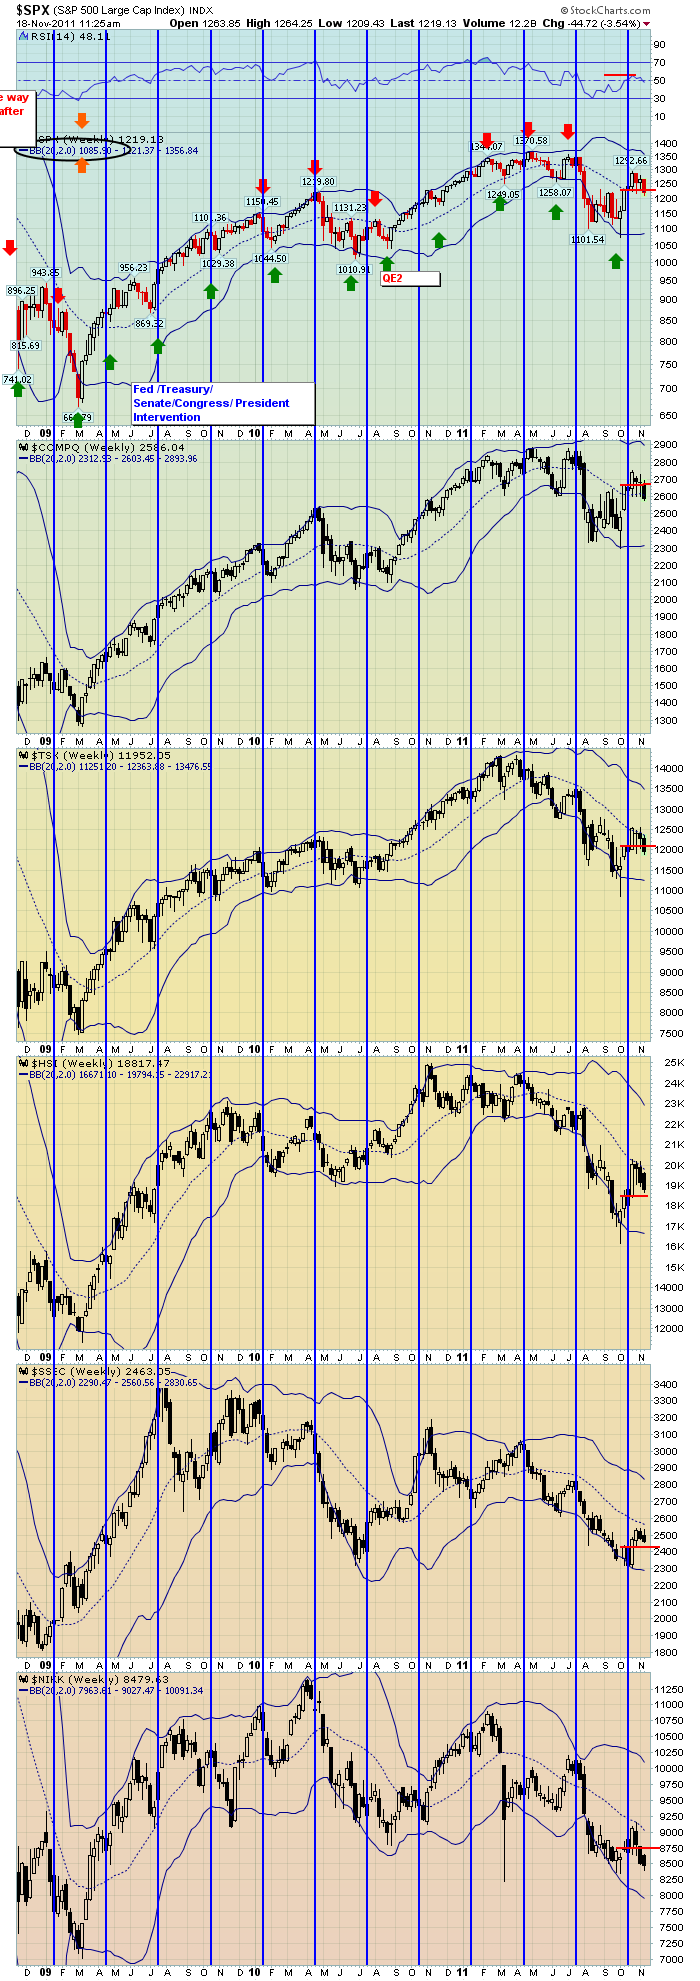
Here are 6 Pacific rim Markets.
The blue vertical lines are the approximate options expiration weeks. Options expiration dates during earnings season (January, April, July, and October) are pretty pivotal.
Notice how the markets ran up for one more week after OE. If you look at a daily chart, you'll notice the following Monday was a large downward candle. We have been making lower weekly highs and lower weekly lows since then.The little red lines on each price chart mark where the markets closed 6 weeks ago. Why 6 weeks ago? Just marking the week before OE. So since the earnings season has wound down, we haven't had anything pushing the markets higher.
Once again, we rallied into the OE, we had one more week pushing higher and have pulled back since. It hasn't been an aggressive pullback, but we definitely have not made any headway yet. The $COMPQ has been trading with lower highs and lower lows for three weeks. I think of this market as the 'RISK on" market. We are trading below where the market closed just 2 weeks after the October low.
Lastly, notice how important the 20 Week moving average is on every chart. This morning the $SPX was within ticks of this line. I'll be keeping my eye on it.
THe $HSI (Hang Seng), $SSEC (Shanghai Composite) and the Nikkei will update later today, But they closed below the red lines as well. On this chart, at this time, every market except the $SPX is back below the 20 Week.The lower BB is at 1085. That would be 'support' on this chart for me.
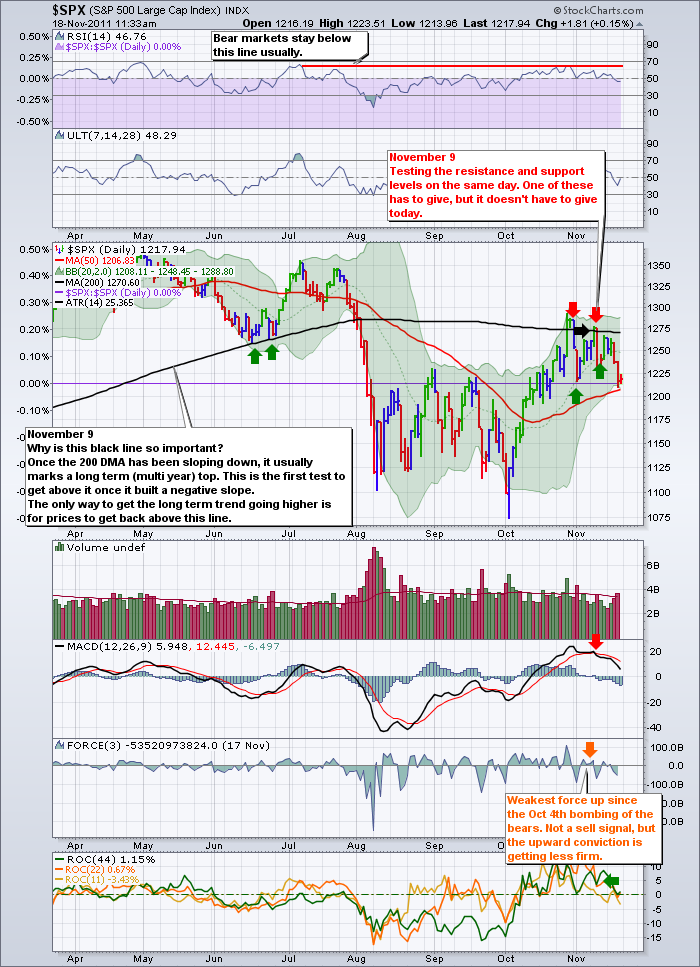
Here is the SPX daily. Bear market signal is still in play on the daily. The main concern I have is the test of the 200 DMA was pretty much rejected. We still have support of the 50 DMA and the lower BB.
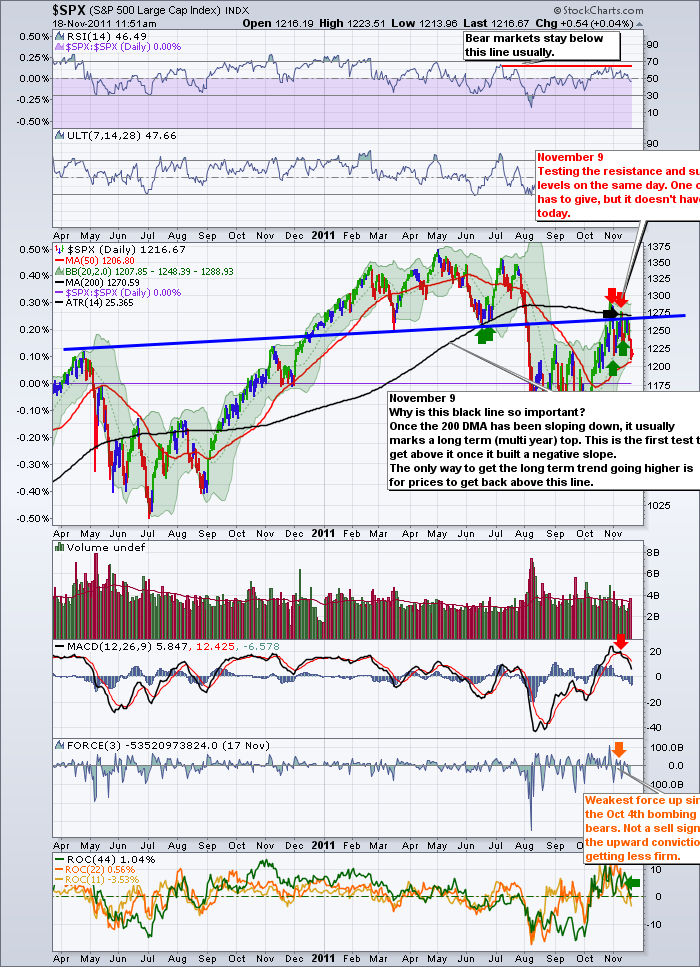
More importantly, The Neckline of the H/S Pattern was tested and failed.
The overhead resistance shows up like a villian. The H/S neckline, the Downsloping 200 DMA, The rest of the world markets are capped by the 20 MA on the weekly. Backtesting (Testing from the bottom) and not getting through sets us up for a tough November. The real questions shart to show up for December. Are we going to continue to make lower highs and lower lows for another month? Then we'll start a rally into January Earnings?
I draw that out as a scenario. It really is amazing how things track. Look at where the lower Weekly BB level shows up on the daily chart. Between the Sept low and the October low. My daughter ran a campaign at school calling it "Awktober".. Well so far, our Awktober is the up month in the down trend.
Between the Asian markets slowing, the Europeans appointing country leaders, and the American markets awaiting the nth Super committee to get the debt on track, there does not feel like a large level of upside momentum.
But every day marks the opportunity for a change in sentiment. So we wait.
Here is the chart showing the H/S Top.
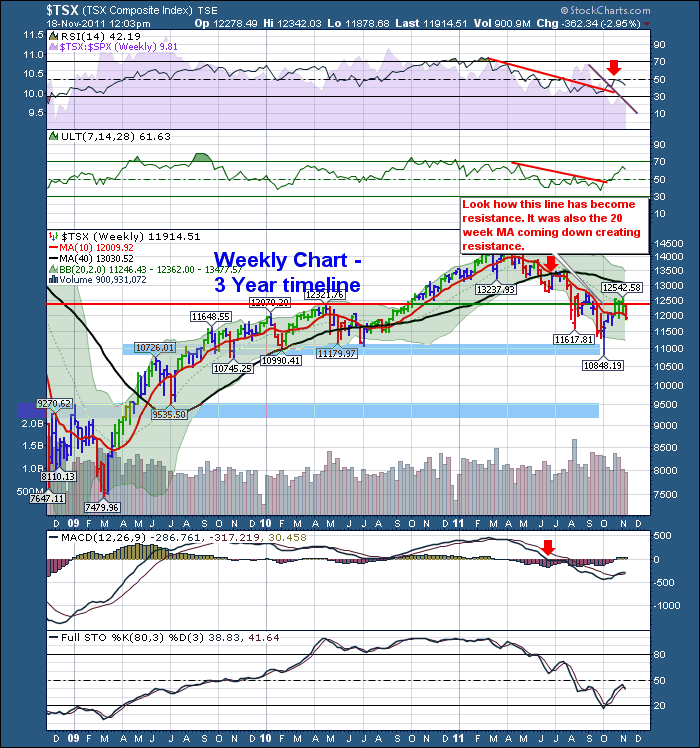
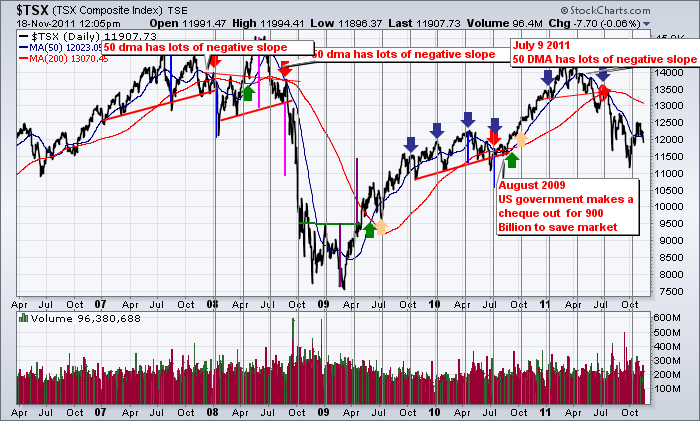
Here is my $TSX Chart.
TSX Weekly
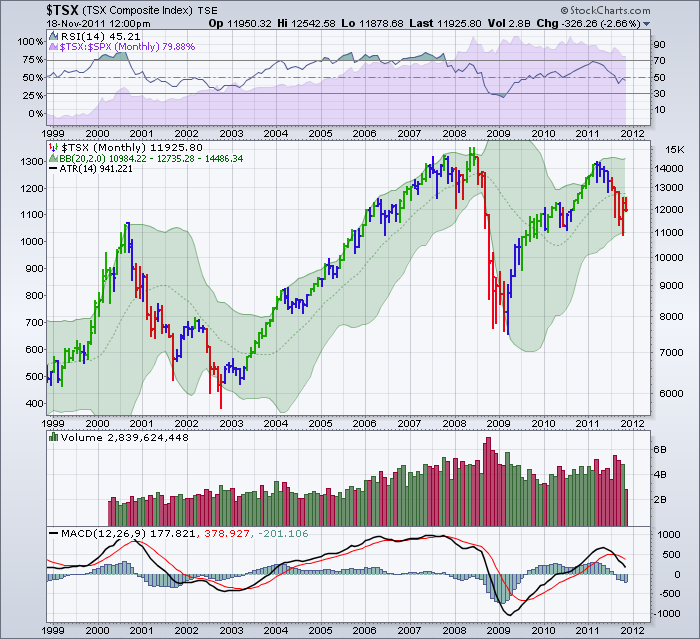
$TSX Long Term
Have a great weekend.
You can click on every chart to go get a larger view.
To subscribe to this blog, follow the link and click top right.
Good Trading,
Greg Schnell, CMT

