Alberta is a hotbed for oilfield service companies. Today, it was a hotbed for investors.
Let's briefly describe what an oilfield service company does. Nothing in the industry happens without them.
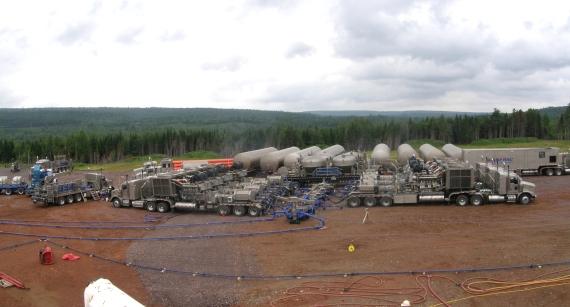
When an oil company decides to drill a well, frac a well, or clean a well that has been plugged up by wax as an example, they call into this group of companies. Obviously there are many companies out there. Halliburton, Schlumberger, TriOcean, etc. are on the US side which is where these index charts are from.
When a drilling rig goes on site, there is a huge number of components to move. The same with a fracturing company. They have a large fleet of trucks and tanks to hold liquid go out to the location and set up their operation.
When the oilpatch is booming, these guys work long hours. When the oilpatch is quiet, these guys get laid off. Really a boom bust environment.
The Calgary Yellow Pages are filled with these companies. I remember a statistic that over 700 of Canada's publicly traded companies reside in Calgary. Many more are private of course. Most of them are oil and gas exploration companies or service companies. The service companies do the actual work.
Here is a picture below from Gasfrac.com corporate website. In the foreground is a wellhead. Behind it, a series of hoses are connected that pump a fluid down the hole. The Fracturing operation extends pressure through the pipe down the hole into the formation. They add pressure to the rock by getting these trucks to pump liquid down the hole and then continuing to add pressure to a specific zone of rock. The liquid carries sand usually. When all these trucks rev up to add pressure, there is a real hummm of equipment. When the specific rock formation cracks, the liquid flows into the formation and the sand holds the reservoir crack open so the oil can flow out. The frac fluid is usually washed back out.
For more videos about all of this, follow this link. At the end you learn why they use a Christmas tree on a well site!
Without getting into the political debate, there is a lot of new technology at work in this field operation. Don't be surprised to find some of these companies have massive earnings as they employ these new technologies.
Today, many of the stock charts showed their investors perceptions for the fall season. They popped up! While natural gas pricing is currently very low, most natural gas fields deplete or empty quite quickly. So there is still a requirement to continuously backfill the production drop as old wells dry up with new wells. Oil at $100 is profitable for many reservoirs, so the oil companies are anxious to drill to keep making money. If the price of a commodity gets too low, the company usually shuts in production to avoid losing money. This eventually helps control the supply and demand imbalance.
OK, lets look at the charts.
Here is the oilfield services index (from the US).

Here is the US ETF that tracks the US index. Nice because we can get the volume and force data as well.

OK. Lets discuss the lower chart as it is the same as the upper chart.
The October rally generated 42% from low to high. That is almost 3 times the speed the TSX moved up. I like that. 42% in a month....
Back on my perch about earnings seasonality, When did the 42% run start relative to earnings season? You guessed it. Just a few weeks before the earnings announcements were to be rolled out. Hey, isn't January only a few trading days away and it's an earnings release month? Just saying....
First of all, it remains in a bear market in my work because the RSI has not been able to get back above 70 since the RSI went below 30. Until it does, I want to manage the trade like a bear market rally.
Secondly, the buying enthusiasm was big in October! Look at all the above average green volume candles...Too SWEET!
Thirdly, a very recognizable chart pattern is currently under construction. The famous double bottom. What makes the double bottom even sweeter, is having it on the backside of a big move up. We know there are investors that loved the success story in October. They'll be back to this sector again.
When you get a massive move up like the October run, we need to check out ideas for a good entry on a pullback. Sitting through this would be difficult. Let's review and find some good places for entry. OK, seasonality is excellent. This is busy season. Commodity prices Oil up, Gas down. But Natural Gas wells with Condensate ( called the NGL's) are really valuable so don't write off Natural Gas wells. What is that?
Detour: Long story. Liquids that are in a gaseous state at high pressure. When the pressure drops down to regular atmospheric pressure, the liquids come out of the gas. So you produce natural gas and liquids.
Back on track: Business...awesome. Can't get oilfield service fleets fast enough. These guys charge as much as they can,when they can, because they have to give the service away at low commodity prices just to keep their experienced men on the fleet through lean times.
OK. I placed four lines on the chart.
1) Where would the stop be? RIght below the last low where the red dotted line is.
2) Look at prices. The lowest blue line. A gap up from here would create a island low. See stockcharts.com chartschool on island tops and bottoms.Very bullish! An assertive entry would be right there.
3) The MACD turning up bullishly and giving positive cross of the signal line could be an entry.
4) All three ROC indicators go above zero. Or even go to the 60 minute chart to see if you can get a slightly faster entry there.
5) an 11 day high. Usually a good entry place. A tight stop works at that level because it is usually a defining point on a chart in a downtrend. My estimate would be around the 120 level unless it accelerates quickly.
6) The top of the centre of the double bottom. Clearing that could be good.
7) Place a trendline off the August high, the November high, the December high. If it breaks through you have an entry.
8) It breaks through 135 which clears the area of recent resistance. Buy there.
9) a move above the 50 day (red line) or 10 week MA.
Where would your exit be on all these buy points? I would not use the same for each one! Maybe a trailing stop of 2 times the ATR. See the legend in the top left of the chart.
So is this a long term hold? Well, not for me. My belief is we are going to have trouble clearing or staying above the DOWNSLOPING 200 ma on the major indexes like the $SPX, $COMPQ. So I will probably use a trailing stop that moves up to help me exit with a profit and not give it all back.
When did this market makes its low and it's high? The same days the SPX made the lows and the highs of October. Even though they have been incredibly busy and working hard generating great revenues, the market has traded everything like European bank stocks.
Lastly, Here is a snapshot of my chartlist and some of the companies I follow in the sector. PS. I own some of them for full disclosure.

Good Trading,
Greg Schnell, CMT


