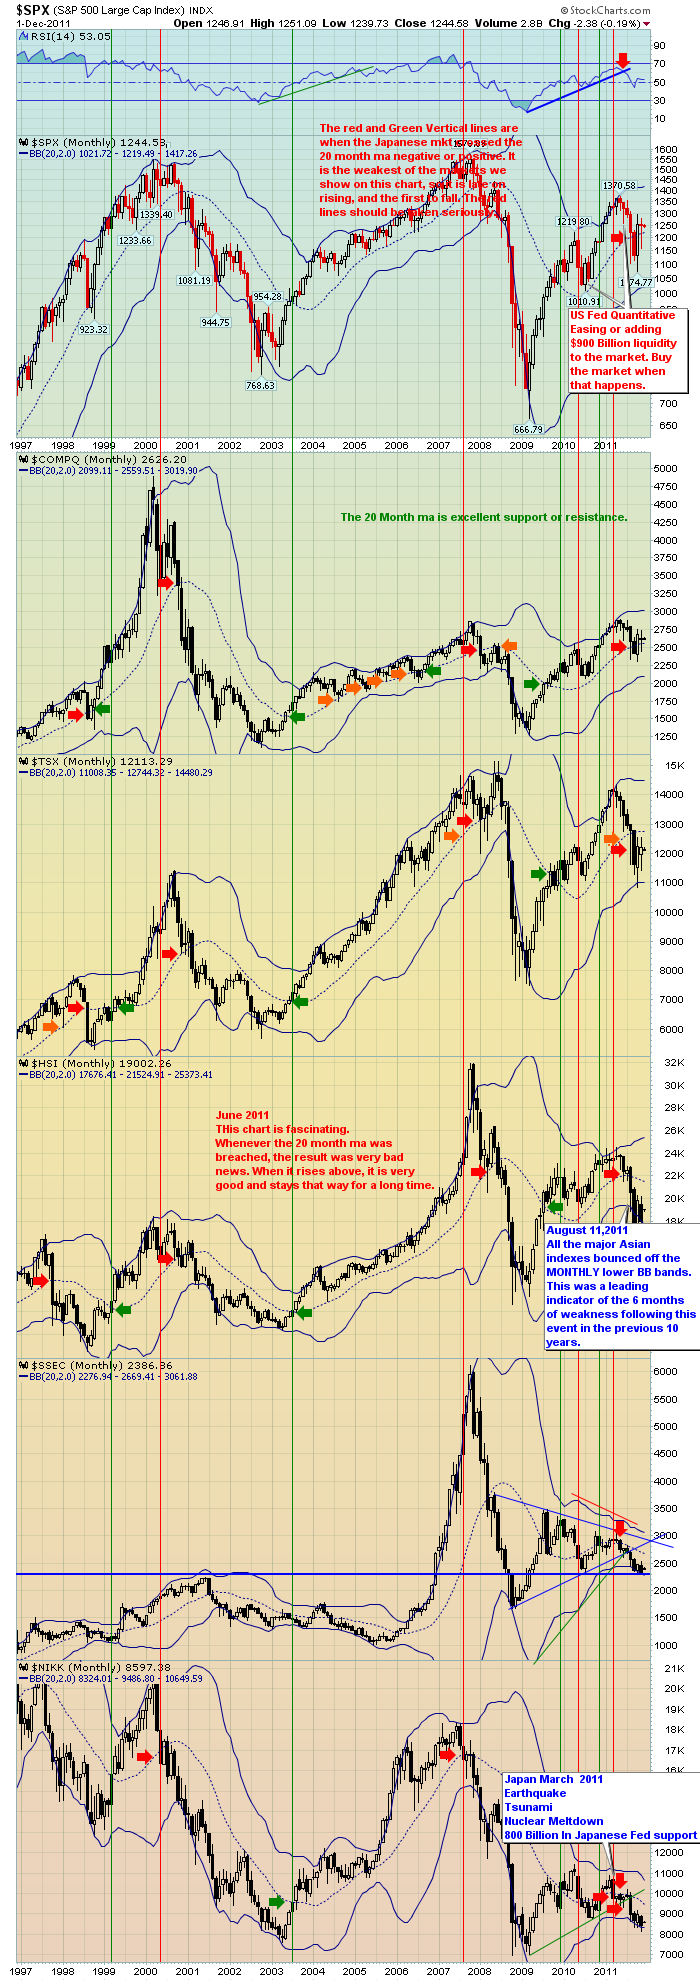
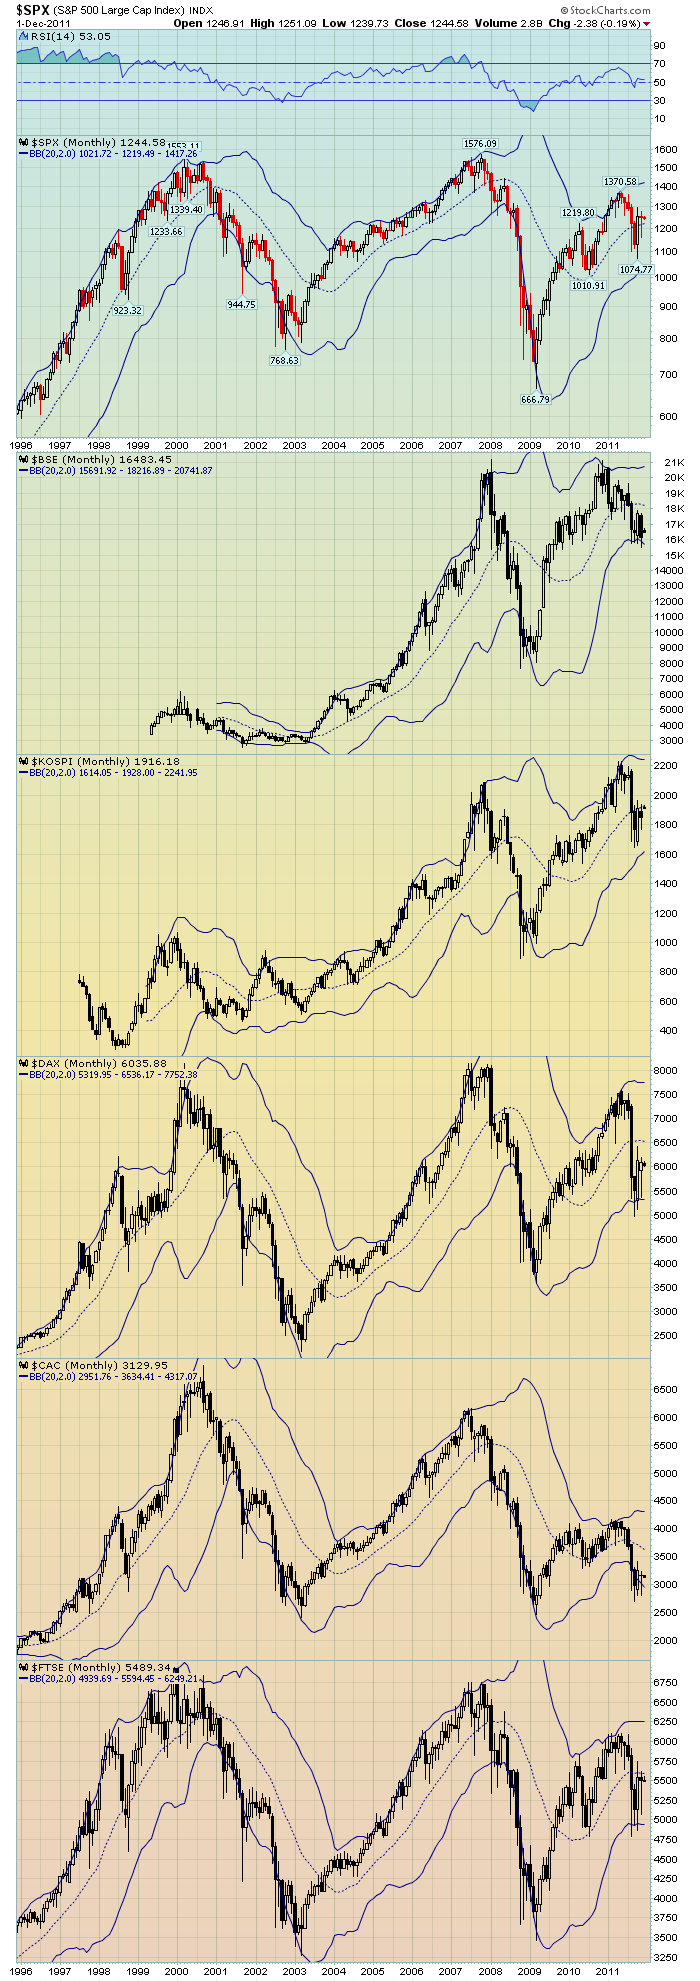
The $COMPQ - The Nasdaq - closed quite a bit lower than October but still closed in the top 1/2. Once again, Notice on these charts, how important the centre line is. It is a real dividing point. If you can get on the positive side, it drives the markets substantially higher. If you stay on the low side, it is usually difficult to make any headway.
The real Question here, is the US market strong enough to pull every other market back above their lines, or will the US market eventually succumb to global pressures and be pulled down. The Fed intervention ensured a close above the centre line by acting on the 30th of the month. Without it, all the global charts would have been below centre.
It is very interesting how well the markets have treated the $FTSE in London. They almost stayed positive, yet they have done some serious economic reform. Interesting how the financial markets have respected their aggressive deficit pursuit. India ($BSE) closed lower than October, and the lowest monthly close since 2010. The $KOSPI in Korea has been one of the strongest global markets. We can see it is under stress but holding up near the centre line along with the $FTSE.
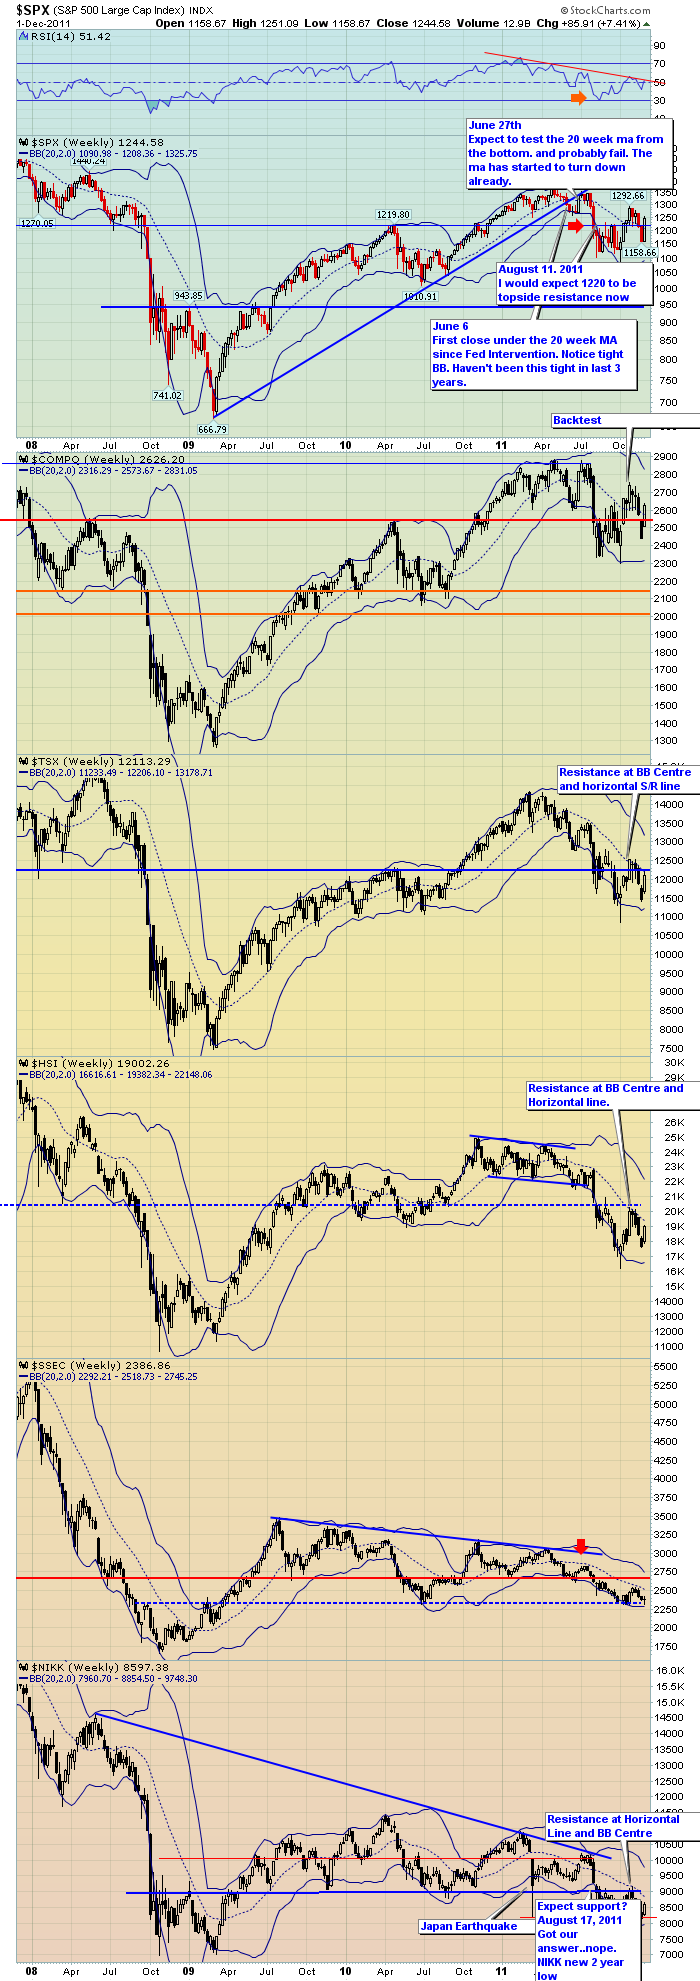
I just wanted to point out how there is a very important horizontal line on each and every market on the last chart. Look at how important this line has been. The Fed intervention managed to push the US markets back above their horizontal support / resistance line, but the rest of these markets remain below.
As we can see, the Fed intervention made a significant visual impact on the charts. On both the monthly and the weekly they were able to bring the November close to finish above the 'lines in the sands of time'.
It makes December remarkably important. Jobs data tomorrow. The ECB and Fed both have rate announcements. The Eurozone leaders will get together on Dec 9. The battle between the global bears and the US bulls is on. The data moves at the speed of the NHL. The Hang Seng moved 1000 points in response to the liquidity announcement on a market value around 18000. The number of moves in October and November that moved multiple standard deviations were remarkable. Canadian GDP had a negative number print a few months ago. If I heard correctly, it was 3.5% on the most recent announcement. Inside 2 months!!!!!!! The US data was 2.5% for the 3rd quarter and was recently revised down to 2.0% . On an economy of 12 Trillion, that's a significant correction.
The markets are remarkably aggressive here. With 2 premarket moves this week at 300 dow points and 400 points it does feel more like a casino. A trade moves 5% overnight twice in one week and treads water all day after the markets open. It doesn't really matter which direction, as they have been just as vicious heading down.
It almost makes the Vix feel irrelevant.
The follow up to the fed intervention is very perplexing. Quantitative Easing by the Fed is widely expected in December. This is inflationary for commodities, but the rest of the globe seems to be pulling back. So Higher or lower for Commodities? Inflation from the QE, or deflation from the global slowdown? Treasury Bonds with low yields leave little incentive to be in that market. A conundrum for every investor.Dividends give you yield, but your capital gets slaughtered.
Every market in the world was affected byt the subprime mortgage which ballooned into a banking crisis. No one feels good about buying into a market while the Europeans appear to have insufficient resources to save all their banks. In this globally connected world, we are acutely aware of the linked relationships in global issues.
Everyone in Europe seems to be buying time. The Italian yields that investors required to entice them to purchase Italian debt, doubled in one month. That is expensive time.
Good Trading!
Greg Schnell, CMT


