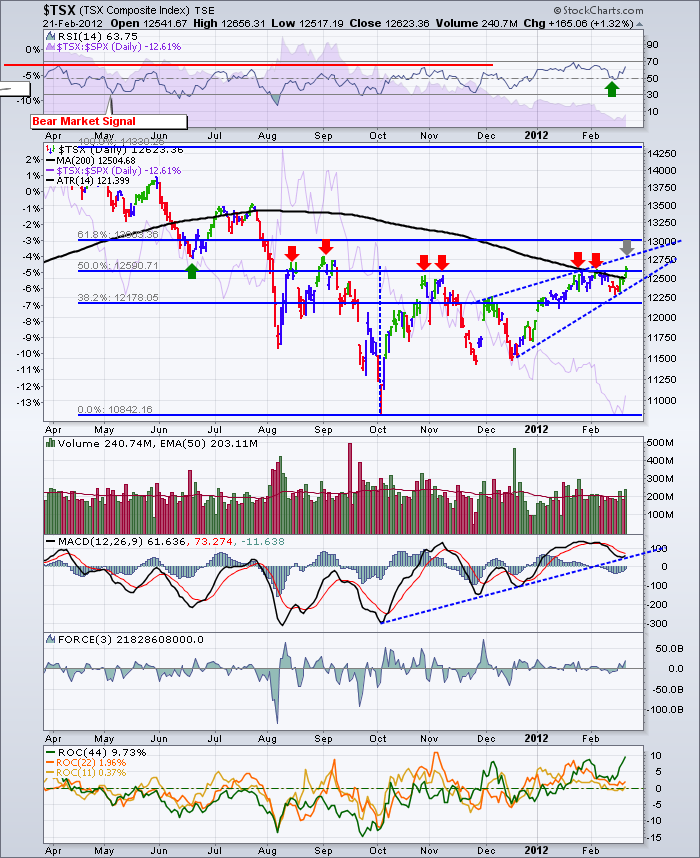
Hey, the $TSX finally broke above its 200 DMA. Let's enjoy the rally!
What I like is that we finally broke above the 200 DMA with volume. As you can see this area has been resistance in a big way.
Let's list the resistance and check them off as we go past them.
1) 200 DMA - Black line...finally above it.
2) This 50% fibonacci level at 12590 is very important as you can see by the red arrows.
3) There is more resistance around 12750 to 12800. You can see we got turned back there twice before. It was also a support level previously on the chart.
4) The dotted blue lines mark out what is called a bearish wedge. Essentially, as the price moves higher and higher, the range gets narrower and narrower. Eventually it breaks down out of this pattern through the lower blue line and that would be a sell signal.
Should this breakout above the 200 DMA fail, we would use the rising dotted trendline as it gives us a tighter stop.
The rally was meaningful today. Some of the OIl service companies were great today. Obviously Gold caught a bid as well. So did $Copper!
No time to fall asleep here. I have 4 European summits marked on my charts in the last few months. It would appear the agreement isn't anything new today. So should the bond yields start to drop, the USD start to rise, or the Cdn $ start to fall, we would become increasingly worried about the sustainability. That fear exists on every breakout.
One note of caution, the transports had a bad day today. See last weeks article on Dow Theory.
Good Trading,
Greg Schnell, CMT


