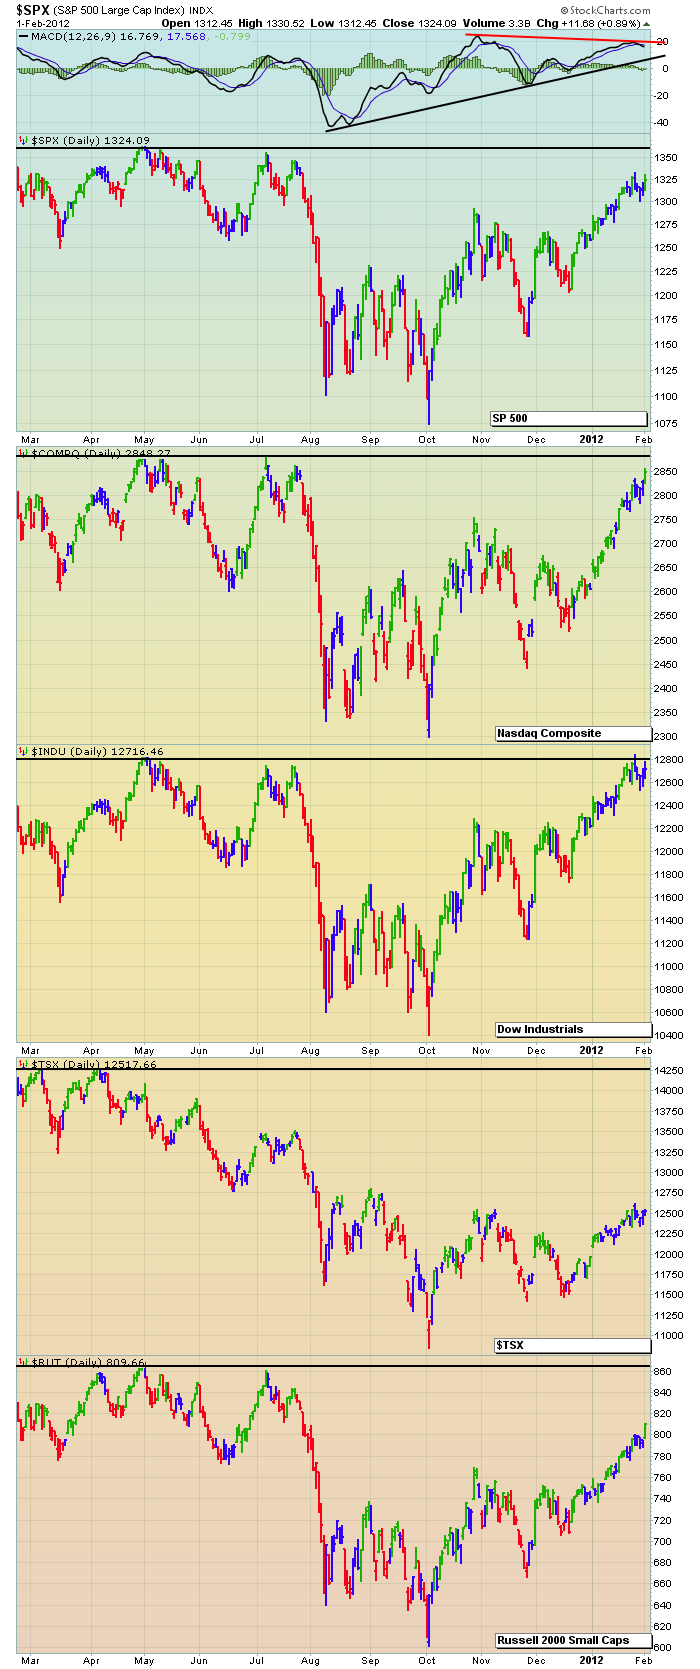
Well, here we are. Testing the top of the markets again.
The intraday price action today was very interesting. The Dow made its high around 10:15 in the morning. It drifted sideways for a few hours, then fell out of bed. All the indexes peaked in a different hour of the day it seemed.
I have posted this chart to show how the indexes compare to their previous highs of 2011.
You can see some are approaching their previous highs, but some are still a ways away. Let's focus in on the price action in the last month to demonstrate how the market changes character as it approaches previous highs.
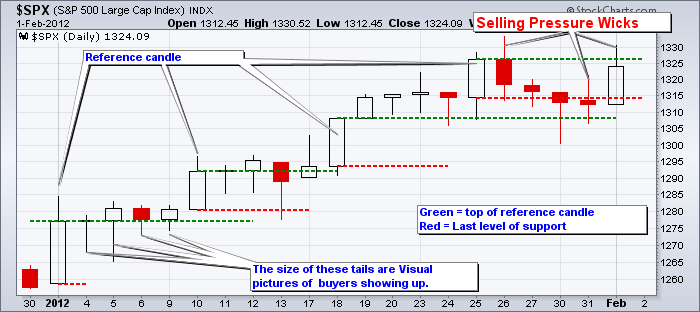
Dan Gramza does some interesting work on Candle analysis. He is always focused on the size of the tail and the price relative to the previous candles. Especially to a long candle. So when the price moves above a tall candle, the Candle has 3 different levels of support. The top is the first level of support, the centre of the candle is very important, and lastly is the bottom of the candle. Using these candles as reference candles is very enlightening. I would refer you to Dan's free videos at dangramza.com
OK... how does that fit in to our discussion now.
So lets define these candles.
The size of the middle part of the candle is important.
The Big Candles become reference candles.
The 'tails' below are buying pressure.
The 'wicks' on the top of the candles are selling pressure.
The Green line is the new level to push above.
The red line is the lowest level of support. In an up market, the lower level usually forms a support layer and the stock usually continues higher (obviously) if it can hold.
Each new large candle becomes the reference candle. This is really short term work.
In the above example which is a 1 month view of the SPX you can see how the price has climbed relative to the reference candles. Until now there has been very little selling pressure.
The pullback after last weeks large candle from Fed day was testing the bottom of the candle. Today we got a big push up, but the market settled back to end the day creating a large wick on top. Having these large wicks is not great. Now, can we push past them? That is exactly what the market is trying to figure out.
You can see the reference level of 1307 was important. The market is holding above 1307. However, the market has traded sideways for 10 days. It rallied today on no news, but it was unable to make new highs.This was also the first week we had a close below a reference candle. We actually had 2 closes below.
I have written often about how the market rallies into earnings and then we seem to get a pullback.
The chart at the top of this blog shows how we are testing the May 2011 highs. Seeing the selling wicks start to show up as we approach the previous highs is not that surprising. What makes it more important is that tomorrow is really the last major day of earnings. Friday has about 10 companies where Thursday has about 50. The majority of the SP500 will have reported by then.
Lastly you can see in the top chart that the $TSX has really been underperforming the other stock indexes in the US. You will also notice (not on this chart)that in up markets the Canadian $ performs well. So it is a difficult choice. When the market is rising the USD gets weaker and when the market is pulling back the USD has gotten stronger. It is exactly the opposite of what we as Canadians would like to see for investing in US stocks.
We'll continue to watch the flow. One of The Canadian Technician blogs this week talks about days where we hit a significant number of new highs with volume immediately after earnings. That usually marks a top. Well, that happened today. Chart the $NYHL and the $HYHGH. With the MACD making a noticeable push over 40 to near 45, it also looks like confirmation. We just don't know till tomorrow. Was today just a test and we continue on higher tomorrow, or was today a day we spent all day trying to make new highs and we couldn't. Has the market tested the recent high and failed? That is what makes picking tops difficult. Till more data arrives....
Good Trading,
Greg Schnell, CMT


