Apparently the English language has more ways to say the same thing than any other language in the world. I guess we were blessed with Shakespeare or finance guys.
When things repeat, we have many different phrases for them. There is pattern recognition, repetition, cycles, behavioral finance, following the herd, overbought, oversold, breakout, failed breakout, etc. etc.
You can see most descriptions above, in this chart:
RN Elliott back in 1934 found an interesting pattern that repeated in multiple time frames. He would see this as 5 waves in the primary direction and 3 waves in the corrective direction. During some of the corrective phases, the market would make a sideways range bound pattern that he labeled x,y,z. He created exceptions and rules, and found a methodology that is practiced today by Elliott Wave practioners. But more importantly, he found these patterns in all time frames. From the subminuette right up to secular trend.
Humans, having such a short life span, have typically not believed the bigger picture on the long time frame because it is outside the normal living pattern. Americans think Canadian house prices will fall, just the way the American house prices collapsed, Because it has not happened to most Canadians before, they have trouble accepting it even though they watched it right next door.
We think nothing of a sideways trading range on a daily chart or even a weekly chart. As an example, Microsoft has been trading sideways for 2 years, and it has been trading sideways for 14 years. Recently Microsoft just made 21 month highs. Upon clearing a prior high, now it is trying to make 4 year highs. Then it will be 11 year highs. But if you pull up a 15 year chart of MSFT, it has been in a sideways trading range for 14 years. You haven't made any money except the dividend in 14 years if you held it.
One of the reasons I ended up getting seriously into technical analysis was buying AAPL above $200 in 2007. I sold a month later with a massive loss, and decided to get better at reading charts. I was in a great stock, revenues and earnings were growing, and I took a massive haircut. So entry and exit were very important, regardless of the story.
I currently look forward at world trends and I see an interesting 10 years ahead with ground shaking volatility.
We have the Euro zone issue.(personally, I think they need two currencies...one for the strong triple AAA countries [EURO] and one for the rest [MEDO]. This would help both groups. The weaker currency would drop more in recessions and allow the poorer economies to stay competitive.) This will need an outcome but it will probably rock the markets for a while.
Then we'll have a magnificent rally.
Italy might be its own event. They have to finance $400 Billion this year or 20% of their total debt load at double the interest level it was at.
Then we'll have a magnificent rally.
Then we have Japan with 225% Debt to GDP. That will be big also as the largest debt to GDP in the developed world.
Then we'll have a magnificent rally.
Last April, I was at the Museum of American Finance and held my wrist watch up to the national debt clock. It took roughly 45 seconds to increase the US debt by $1 Million dollars not including entitlements. I recently did the same thing using the internet debt clock and my wristwatch. It took roughly 30 seconds for a million dollars.
Let me express that another way. Last April it took 3 minutes to create $4 million in debt. This week it took 3 minutes to create $6 million in debt. The rate of change (GROWTH) is roughly 50% per annum and we still have 2 months left for a total year to pass.
I think the market will have a hiccup while this tries to get dealt with.
Then we'll have a magnificent rally.
Of course, there will be a few wars, some revolutions, the property bubble in China, Instability in some oil producing region, assassinations, Nuclear meltdowns, earthquakes, tsunamis, floods and financial crisis situations other than those above.
Then we'll have a magnificent rally.
All that to say, being a great trader will probably produce great wealth in the next ten years by managing through the disasters and getting long when everyone is afraid. Don't be afraid to look at the big picture.
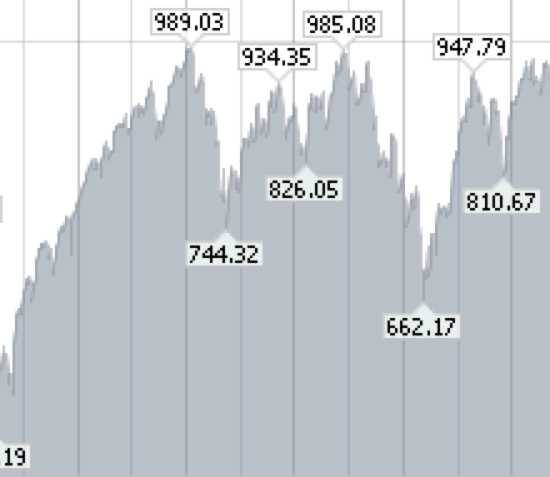
Consider this chart:
To me this chart looks like a trading range.
More importantly, sell at the top and buy at the bottom. Of course, you never know what the right hand side of the chart will do next, so we need to plan for both directions.
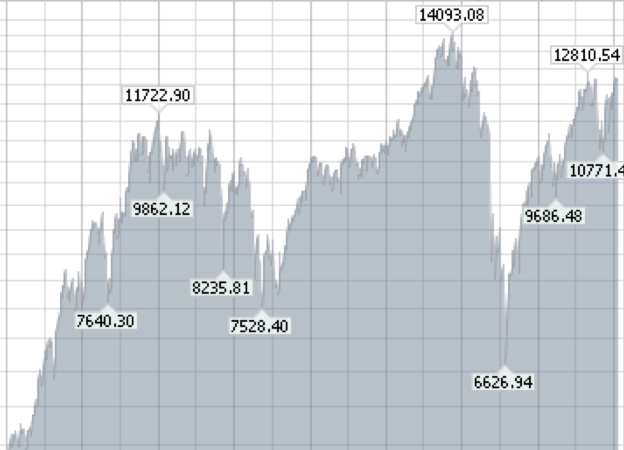
Now here is the current chart of the same ticker symbol:
Do these charts look similar to you? Both charts are of the Same ticker but on what time frame?
Remembering our good friend RN Elliott from 1934, sometimes patterns show up in the same time frame or in different time frames as ‘fractals' of similar patterns in larger time frames. Again, similar patterns show up again and again in different time frames. We are naturally optimistic. This trading pattern is not uncommon in 5 minute charts, hourly charts, daily or even weekly charts. It also shows up on monthly charts.
Would you like to know what happened on the chart?
Remember the past does not predict the future so the outcome may be different. I just chose one pattern than seemed obvious to me. They both look like camel backs with different elevations and depths. Here is the chart of the Dow from 1962 to 1986. 24 years. I cropped the chart above at the blue arrow. On the picture above I put a bow tie which I replaced with the blue arrow. From the beginning of the chart to the blue arrow is 11 years.
So to compare, the current chart I put up has been 16 years so far. 1996 to 2012. All of these charts are the $INDU. As an example, what if it took another 18 years before the market could finally break to the upside? Let's not be pessimistic or optimistic, let's make sure we take profits and protect as we move through the years.
Keeping an open mind that the next move could always be up big or down big obviously. Most importantly we must use risk management as the swings against us and with us are equally challenging. Ask the Apple shareholders after a $40 haircut in 5 hours of trading just yesterday and this morning.
It won't be easy but the best will retire with enough for retirement. Lets stay on that side of the trade.
To subscribe, follow the link to The Canadian Technician. If you look in the top right you can get it by email or other methods. You may also find it on Stockcharts.com Facebook and Twitter feeds.
As a reminder, the CSTA is hosting two great speakers in Calgary in March. Tom McClellan and Ed Carlson on different days. Head over to www.csta.org to register.
Good Trading,
Greg Schnell, CMT


