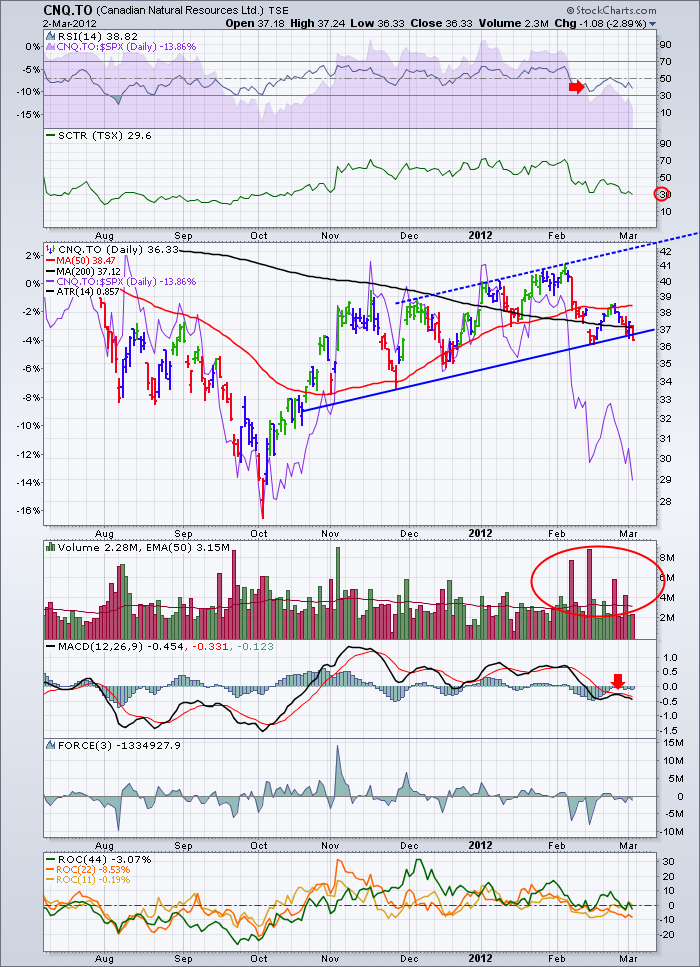
This is the equivalent of the famous stockcharts blog - "Don't ignore this chart!"
This stock has been one of Canada's institutional favorites. It has soared with every oil price rise for 2 decades and plummeted in the 2008 commodities dive. So Oil hit $110 this week. How did CNQ respond?
This chart is showing more stress than a central banker in 2011.
Let's start at the top and discuss why this chart feels shaky.
1) RSI. Recently when oil broke out, this stock was living below the 40 RSI line. As oil hits $110 this was still below the 50 .... ouch....
2) The SCTR ranking was below 50 and is currently hanging at the 30 range. That means more than 70% of the Canadian stocks are performing better than this stock. It is becoming very unloved or at least, unrespected.
3) The price chart. Look at the action of the moving averages. The 200 DMA is on a downslope and the 50 dma is moving above. That is good. But look at the 50 dma. It was resistance for the last move up in price. The stock is currently trading below both moving averages. That is not good. The price channel the stock was in, was broken to the downside on Friday. Now, that isn't the end of the world. But Crude going through $110 while this is going on is a real problem. Something is happening and this stock is not being supported. Look at the SPURS line which is in purple. It is plummeting. So relative to the SP500 it is underperforming terribly. Think about the SP500 going up for 35 days in a row. Think about the TSX breaking above its 200 DMA. See how poorly this stock is behaving?
4) The volume. Look at those red candles yelling disatisfaction! This is really a strong signature of the weakness.
4) The MACD. It recently fell below the zero line. That is telling you to watch carefully. But with SPURS plummeting, that is really a strong signal that protection is in order. Protection means buying puts, selling some of the position or all etc. But look what happened at the red arrow. The MACD tried to turn up and cross the signal line but couldn't ...that is confirmation of weakness.
5) The force index. Almost no positive force since the 1st week of January. Even with Oil moving $15.
6) Lastly, the ROC has all three lines going below zero. That is never good.
OK. What do we need to see in order to define the stock improving? First of all, the price has to regain the trendline now. The stock has to get back above the 200 DMA soon. With oil hitting new highs, I am not sure what can drag this higher if higher oil can't do it. We know Natgas is a problem. Let's hope it gets some momentum, but right now...it's in trouble. Change that...it might be in the institutional sell block.
Good Trading,
Greg Schnell CMT.


