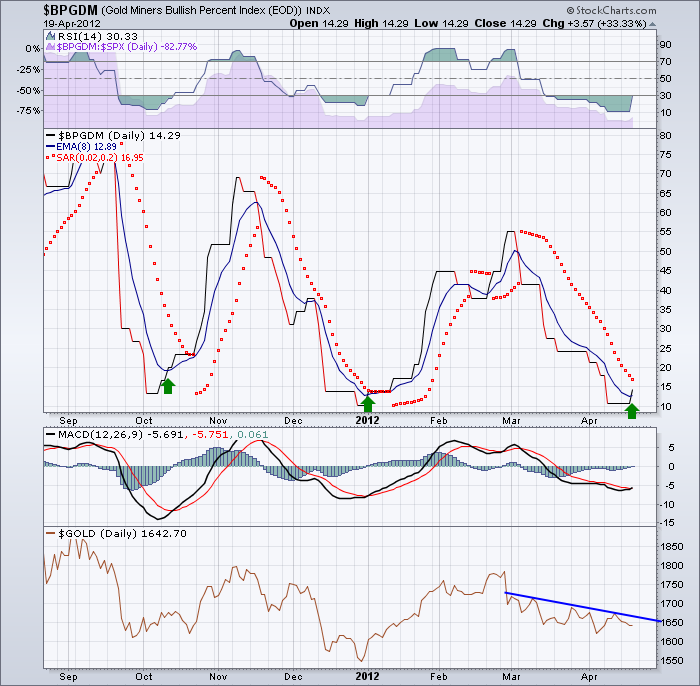
The Bullish percent index for gold miners turned up today. Now it only takes 1 or 2 stocks to make this change, but considering $GOLD was little changed it was interesting. What would cause a few stocks to go on a buy signal on P and F charts when the underlying day was weak? I like to look at $GOLD and I noticed it likes to bounce from around the 25th of the month to the 8th of the following month. Is this the start of something big?
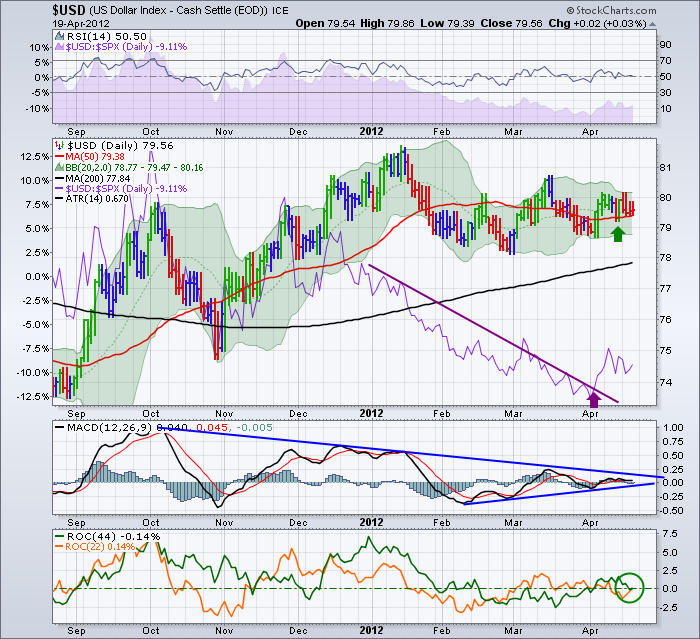
The bottom line: We have a signal on the $BP for gold miners. But the $USD looks like it is breaking higher not lower. My conviction is low on $GOLD breaking out here.. But it is a signal I like.
The copper chart has had 4 days of long tails so someone seems to be trying to buy it and support it here. Is that just for Options Expiration?
Maybe this is the start of the long awaited commodity rally. Wouldn't that be great! The MACD on $USD looks like it is ending the long move it has had. The breakout should begin with gusto either up or down. On the $SPTEN the MACD just made a positive cross but it is still well below the signal line. The $TSX was up 25 points while the US market was down in big volume. The $SPX rallied late in the day to close near the 50 DMA. The dow closed down 68.
A look at the Aussie market and it is up near resistance. The Aussie MACD is in positive territory so I like that. I get the feeling which ever way the $USD breaks out will drive the commodity market breaking out the other. On Monthly charts I am still bearish, but the Daily/WEEKLY is starting to perk my ears up on the $AORD. The RSI is above 50, so we'll if it gets any resistance near here.
Good Trading,
Greg Schnell, CMT


