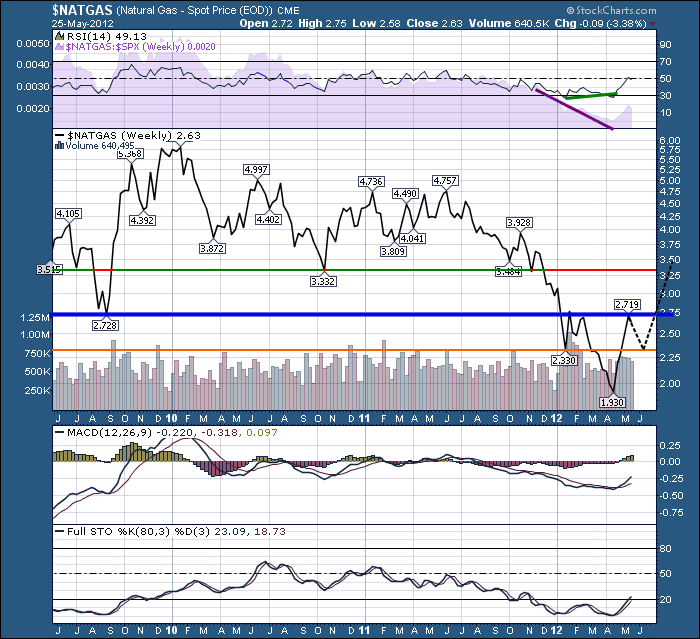
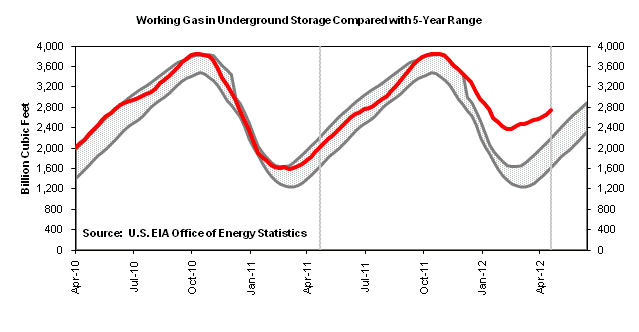
Interesting how Natgas bottomed the last week of April when the SPX topped. Hedge fund mania or a real change in the supply/demand? Here is the inventory chart from the EIA. The red line is the current year, and the grey shaded is the five year range.
If this sideways trend on the inventory can get back inside the 5 year range, this would be great for Natural Gas stocks. I am surprised that we have not seen a lot of mergers and acquisitions in the Natural gas space. I would expect buyers to start bottom feeding now with the nice head and shoulders bottom pattern starting to show up. Natural Gas has been a very unique commodity trading almost immune to other commodity elements like $WTIC and $GOLD. I'm getting my buy list ready.
Good Trading,
Greg Schnell, CMT

About the author:
Greg Schnell, CMT, MFTA is Chief Technical Analyst at Osprey Strategic specializing in intermarket and commodities analysis. He is also the co-author of Stock Charts For Dummies (Wiley, 2018). Based in Calgary, Greg is a board member of the Canadian Society of Technical Analysts (CSTA) and the chairman of the CSTA Calgary chapter. He is an active member of both the CMT Association and the International Federation of Technical Analysts (IFTA).
Learn More


