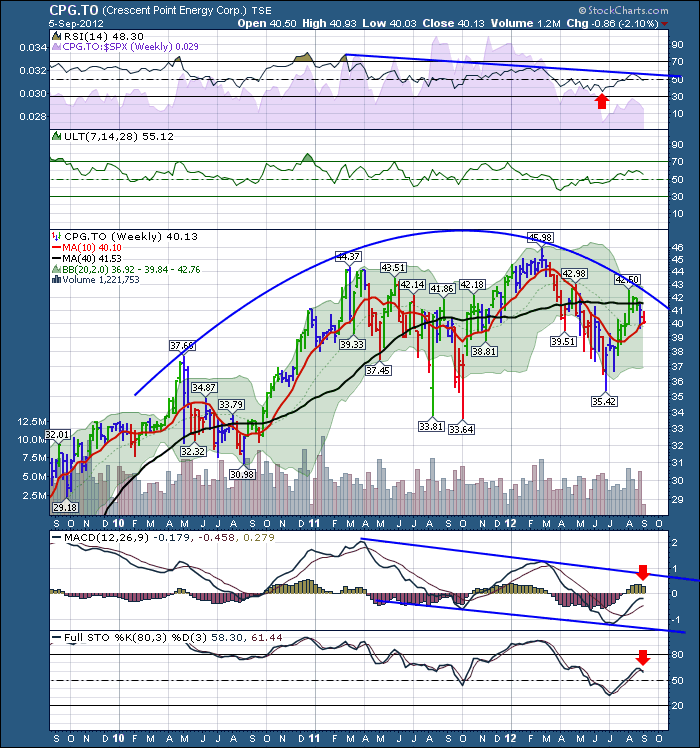
I pulled up Crescent Point Energy today.
This arc looks like a moon path moving across the south sky. It can also be called a rounded top.
Crescent Point has started to make lower highs on the weekly chart, but still has some higher lows. It is definitely at a 'point' on the chart that bears watching. The blue moon last week also produced a blue candle on Crescent Point's chart. What bothers me is that as oil has held up for the last 5 weeks, Crescent Point has made some lower lows and lower highs for 5 weeks .It now sits below the 40 week and try to find support on the 10 week.
The MACD appears to be rolling over and making a decided move down. The Histogram is starting to shrink meaning the upside momentum is slowing. The Full stochastics are not able to get back up into the 80 level even though we are in the bullish season for the oil sector. Maybe this is just the final week of a down move before we start to move higher, but the trend needs some serious moves higher to reverse the MACD divergence. Notice how the MACD in 2012 produced a lower high, even though the price produced a higher high. Currently we have made a lower low on the MACD meaning that we currently have no positive divergence off the recent low.
Moving up to the top, this recent low was the first time the RSI could not hold above 40. That is bearish. I would not get all bearish just yet, but I would flag it with a 'bear caution'.
The red candle this week is particularly alarming. Crude made 5 week highs last week. For CPG not to enjoy a little investor love with an upturn in crude seems very cautionary.
I find the market quite interesting here. Even though the SP500 is trading near 4 year highs, everyone is expecting the Fed to spend bullets to juice up the economic activity. Recognizing the world works in mysterious ways, this seems quite illogical with 1.5% GDP, jobs middling but not great, and IPO's going into the market at remarkable valuations. (FB). I've been wrong so many times on the Fed, I'll be watching with amazement for any policy action. We usually accuse the Fed of being too slow to act.
The technicals and internals for the stock market range from definitely building a market top to historic indicators giving huge buy signals like today's posting at Businessinsider.com
The New highs data is weakening but the market shows very little signs of aggressive selling or high volume churning.
We'll keep watching the technicals, but they have not shown a bullish push as to what Central Bank policies will be coming in advance. Maybe Gold is the market tell this month. The fireworks may start with the ECB's telegraphed move to start buying 3 year debt of the troubled nations. We have a week shaping up that could be a rodeo. Euphoric highs on wild rides, or being crushed into the dirt by the sudden dismount off the proverbial bull.
Good Trading,
Greg Schnell, CMT


