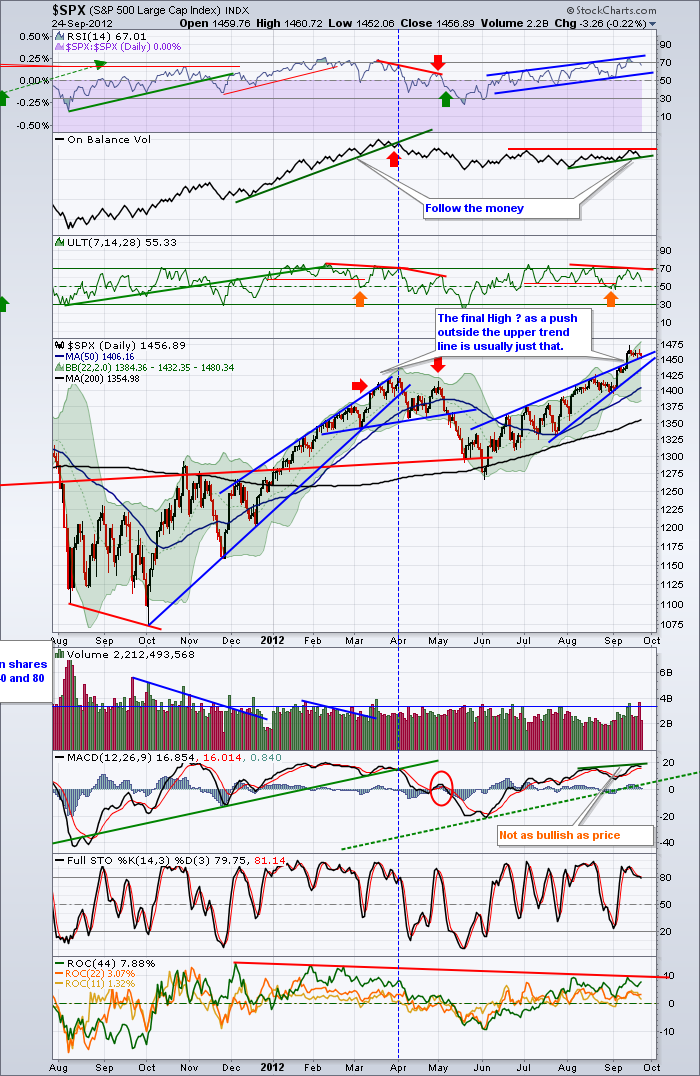
This chart is my working chart for the $SPX. (And it gets worked....)
One of the most interesting windows of the indicators currently is the OBV. During the 2011-2012 rally, the OBV ramped up with the market. On the current rally, the OBV has been significantly muted. I would suggest it is in a sideways range since the June low or comparing the July high. The trendline break on the OBV marked a nice exit for the 2012 spring top. With all the central banks inducing this rally over the last 3 weeks including Japan last week, the OBV managed a brief surge starting around Sept 1 that equalled the July high. It has rolled over since. While markets usually do oscillate, this pullback could be a normal rhythm. Breaking the red trendline above or the green trendline below looks to be meaningful. If the lower green trendline is considered too short, then the horizontal resistance of the Sept 1 lows would be a significant break to 7 week lows. It would not be too much of a stretch to test 8 month lows on weakness.
Secondly, the accelerating volume in March 2012 marked the top of the Spring rally. Recently we have seen volume surging to similar levels. We can make the argument that volume occurs before price. Almost all the volume spikes above the line marked significant reversals (H's to L's, L's to H's)with the exception of Late January's blip. So before we get too bearish looking for a reversal, it could be a pause before the troops advance to 1575.
Lastly, I like using ULT and watching for divergence from the RSI. These lower peaks recently seem to be hinting at some change. As long as it lives on the positive side of 50 we still look strong but the multiple diminishing peaks add caution.
Still appears to need a pullback and a final run if this is to play out. I can't remember who had the phrase but it went something like " Bull markets are harder to kill than a pack of cockroaches." So I'm not trying to kill one, but I am trying to identify where the end of one is, so I can exit with most of my capital intact!
Good Trading,
Greg Schnell, CMT


