Sometimes, the market goes on a tear. Recently, it has moved up fast into what some would call overbought. Markets can stay overbought for a long time, so that is bullish not bearish. But a few indicators identify 'severely overbought'.
There is a variety of indicators that one can use like the % of stocks above the 10 DMA.
I have a few that I like. Here is one that will remain mysterious so we can explain it without prejudice.
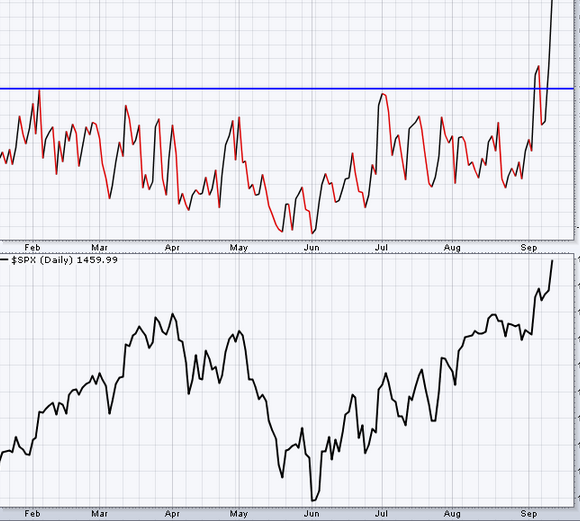
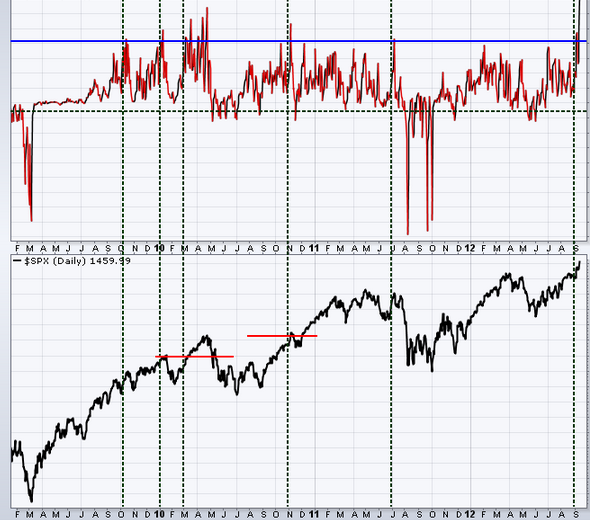
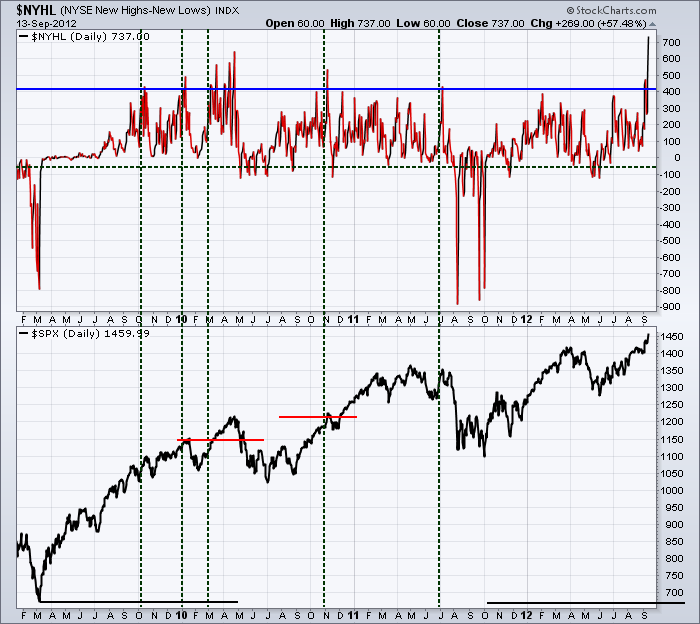
So the indicator is on top, and the $SPX is below.
Here is almost 4 years of data. There have been 5 single bursts above the blue line, and one cluster that remained above this level. The green vertical lines have been placed off to the side so you can see the spikes and the corresponding $SPX reaction.
The vertical spikes led to 50-100 spx point intermediate pullbacks. Obviously the cluster of spikes just kept flying. When the market topped after the cluster, it just dropped and the market pulled back a lot. 2 other verticals led to major drops that fell hard. You can see the Fed spike today created the highest spike in four years. Not sure about the correlation of how high the spike is to the lack of buyers.efunds
Perhaps when the market gets so run up, the hedge funds decide to wait till the market diplays some weakness.
So what is the mystery indicator? What it represents is the difference between new highs and new lows. Regular levels of this indicator don't mean much, but huge highs and huge lows are usually indicative of something.
Anyway, this is the highest reading in 4 years which would lead me to be more cautious here.
Just sayin'.
Greg Schnell, CMT


