Amazon posts the worlds most remarkable resiliency with respect to its shareholders.
One of AMZN'S claims to fame is it's remarkable P/E with earnings sliding for the last 2 years. Why would an equity portfolio manager own it? Well, if you have to outperform the Index to keep your job, it's hard to do if you don't keep the big stocks in your portfolio so you can at least stay with the index. The manager may tweak the weighting, but they can't be left behind so they need to have some of all the major weightings. Look how AMZN fits in the Consumer Discretionary sector and the overall $SPX.
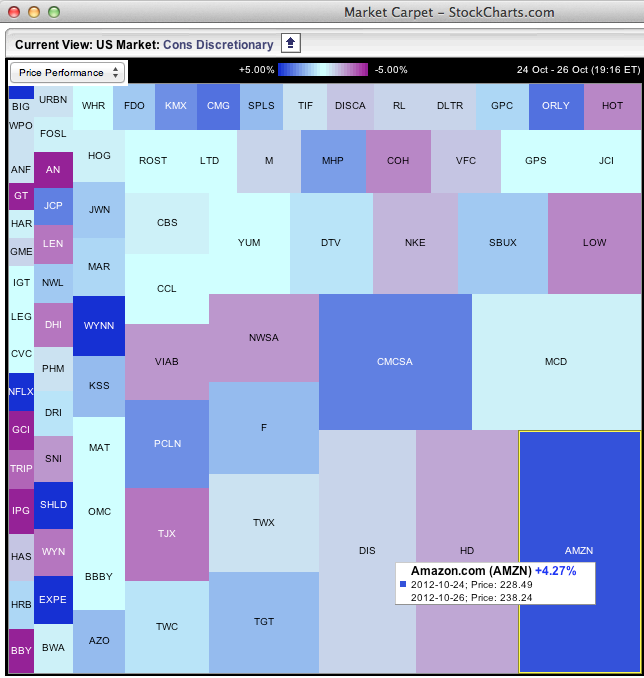
Here is the market carpet for Consumer Discretionary within the $SPX.
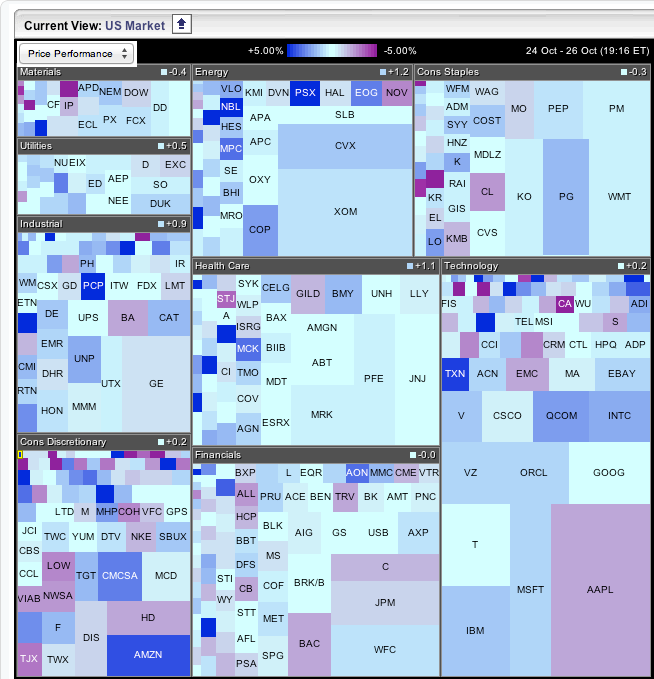
Here are all the sectors.
You can see AMZN is in the area under Consumer Discretionary.
OK, so that is one major reason funds have to own it. I am pretty sure if they had the choice, they would prefer to own something with a more moderate P/E ratio which carries that much weight in the fund. AMZN was up 6.8% yesterday. That hurts if they miss that much weighting in the index.
But here are the hard realities.
Yesterday, one guest was talking about Apple earnings on the talking heads channel. He said fundamentals matter. The next stock they talked about was AMZN. How could fundamentals matter when you compare AAPL and AMZN?? The latter company has diminishing returns each quarter, going into the red paint this quarter. Stock is up 6% today after reporting losses with a PE of 279 and shoots back up to a P/E of 290.
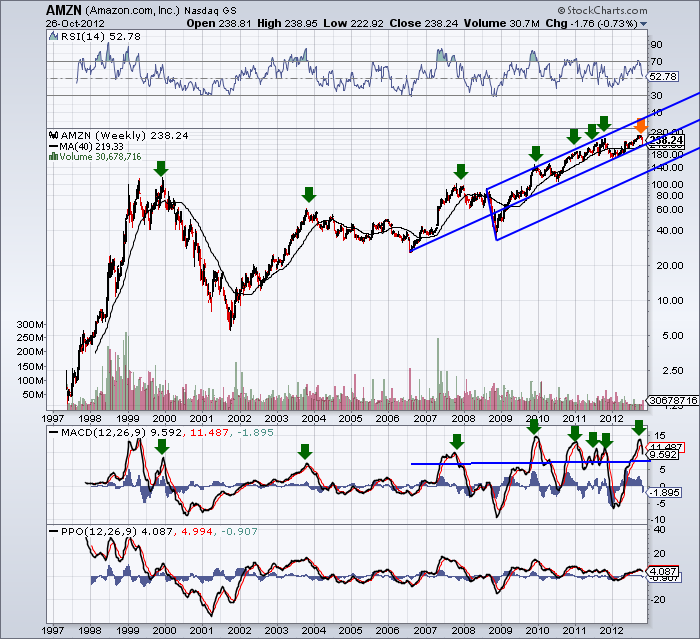
Here is AMZN since inception.
On the chart above, I highlight every time the MACD made major waves above the blue line. Serious momentum surges. So, as price goes higher, it is easier to get that wave up high. The PPO elimates that difference in actual price value by using a percentage change instead. Either way, this is a momentum push. However you can also see in the PPO that they are diminishing every time. At some point, investors bail on a P/E 290 stock. If you left based on earnings, you were out 5 quarters ago.
Since 2006, AMZN was only near/below its 40 WMA in October in 2011. During 2007, 2009, 2010 AMZN was flying going into the Retail playoffs called Christmas. I have ignored 2008 for obvious reasons. To have it back near the 40 WMA in October makes me wonder if the funds are starting to lower their weighting.
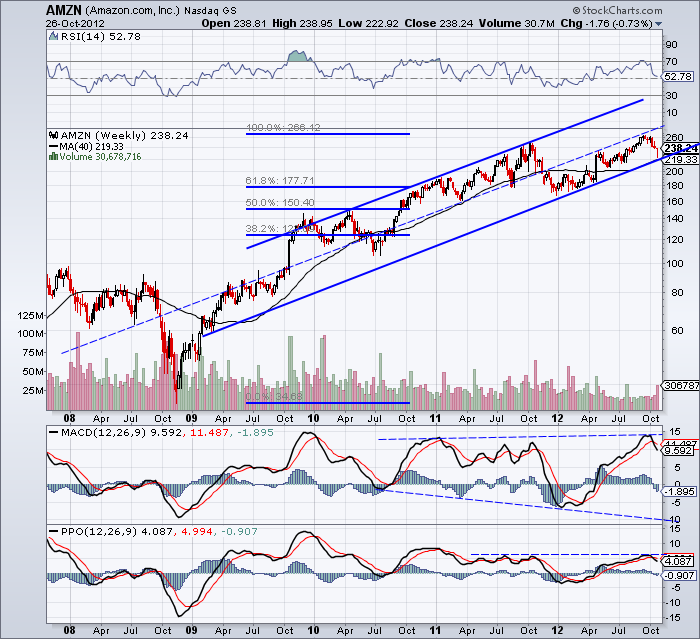
Here is a recent chart of AMZN.
I could have used the Pitchfork tool again. I decided to just make a channel complete with a centre line. What I notice is that on the last surge, the price could not return back to the top of the channel. If Amazon was going to break down, this would be a simple method to notice the weakness. If you read the chartschool on the Pitchfork, it is very important when the lower trendline breaks. In my books, that is a very important line as well. More importantly to me, the MACD plummeting well below zero is a concern on the last dip. This negative divergence on the MACD bottoms can be an interesting signal. If you look at the MACD on Apple, it made this broadening formation twice. You can go look to see what you think. While the volume has been low on everything lately, look how quiet the last 5 months has been.
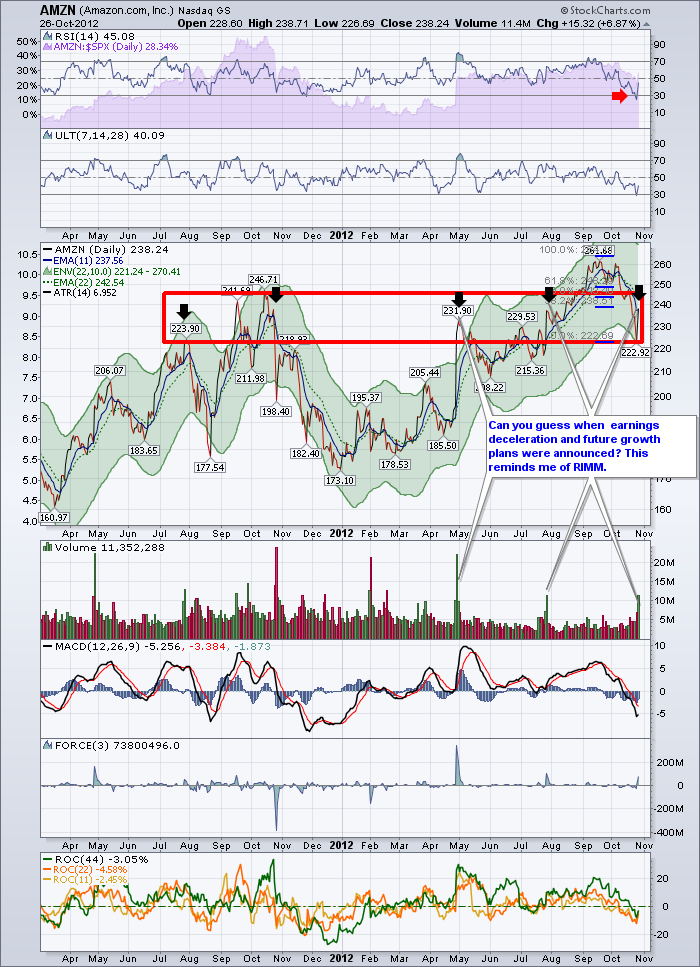
Here is the chart of Amazon Daily.
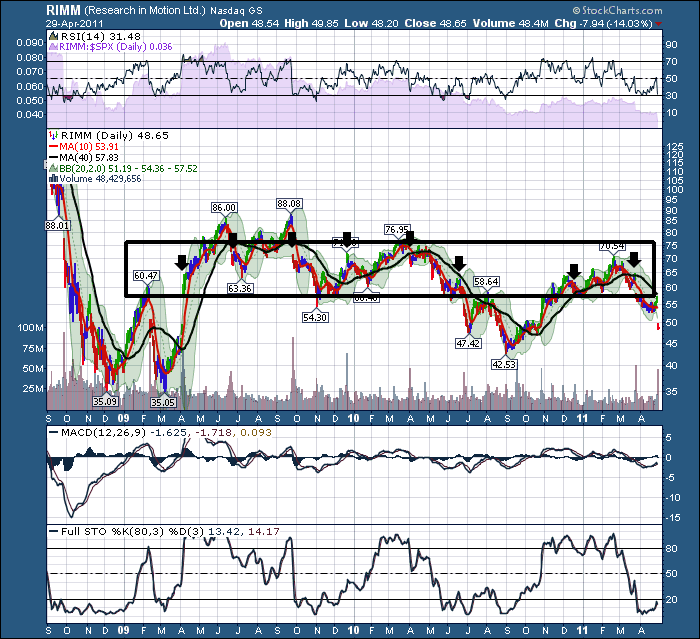
Notice how the price of the earnings has been at the same level for the last 5 of 6 quarters. When a stock breaks down, sometimes there are very few signs. I see many things I would look for to short a stock in AMZN. Failure of price to progress, volume drying up in the final uptrend, slowing earnings, broadening MACD on the weekly, 3 year channel break appears imminent. But the price is the final tell. When it no longer gets support and the price is actually breaking down, that will be the confirming signal. On the chart, this flat price action during earnings happened to RIMM. RIMM traded around the earnings period within $10-$15 over a period of years before finally failing. I'll show you what I mean about RIMM.
It looks to me like AMZN might bounce up and needs to retest the 10 WMA from below. I know what I'm looking for and if I get it, a short position would be an interesting trade. I have been wrong before. The critics of TA will say if failure is predicted every year, one year they'll be right! Within the last year, AMZN gave me some signals that led me to believe I would be right. Ended up wrong. I think it is important to plan your trade, place your trade and your stops, work your trade, exit your trade. AMZN looks amazingly close to being a perfect short from a 290 P/E. It's not there just yet. When growth stocks lose momentum, it can be significant. We'll see how it goes from here. I have no position in any direction in LULU, AAPL ,RIMM, MSFT or AMZN at the time of this writing.
Good Trading,
Greg Schnell, CMT

