As we lead into the Options expiration Friday, the markets are getting a little bounce.
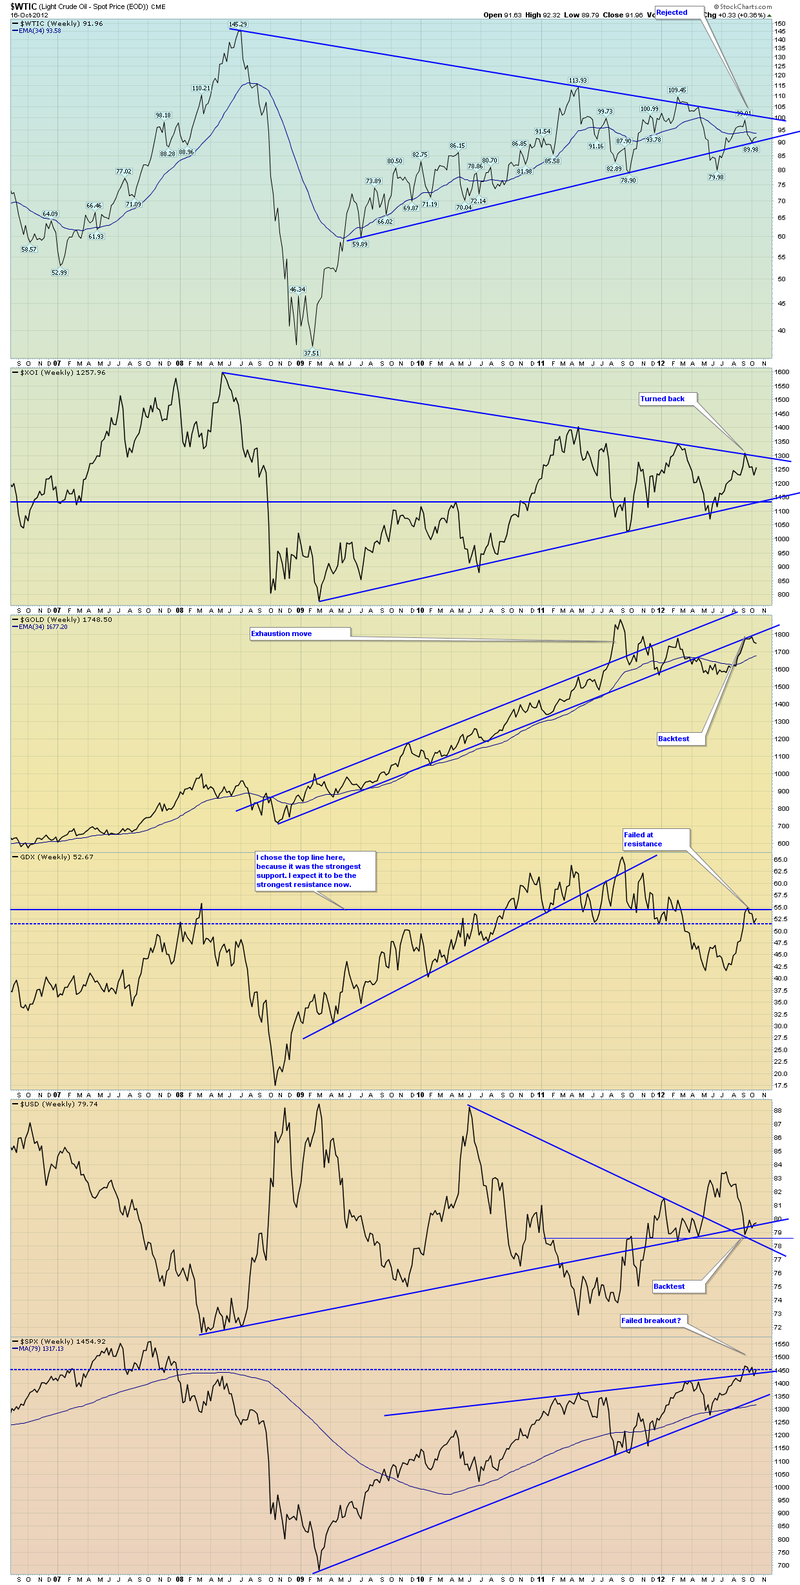
Check out this set of weekly charts.
1) This is a 5 year trendline in oil. What a massive pennant. A little worried that the break below the bottom line in the may pullback might be telling us the new direction. You will also notice a horizontal line support right at $79. If the $USD goes higher, I think crude goes lower and visa versa.
$XOI. This $XOI chart has a pennant pattern that mirrors the move in oil. 2 giant 5 year pennants. XOI is the Oil Index. It is a group of the global oil majors.
$GOLD. After the huge exhaustion move, $Gold made a nice retracement. The real important thing to notice was the backtest of the horizontal trendline from the bottom. Many, many times these resistance lines stop upside progress. Is that what is up for $GOLD?
GDX. By checking the Gold miners index we are looking for bullish signs. Here we sit having failed at a test of the horizontal trendline.
$USD. The Backtest of the downsloping trendline from 2009 is pretty important in my view. You'll also notice the horizontal trendline that was also providing support now. The uptrend line is also important. Currently the USD is above two of these and is holding at the third trendline. IF - big if - the Yen breaks down, I would expect the USD to move higher quite quickly. This would be bad for the commodities and I believe the US stocks as well.
$SPX. Currently it looks like the $SPX has had an exhaustion move above the trendline. Now it has failed and fell back inside.
So here is my point. It would appear all of these charts are synchronizing around the trendlines on their respective charts. The patterns are different, but very relevant and common rather than obscure and 'first time' patterns. If the USD breaks higher, and the Yen followed by the Euro weaken, I would suspect all these charts will move in tandem.
This feels like a global lightswitch. If the $USD turns on and pushes everything else down, we start to mirror a Japanese outcome. If the USD fails here at this level, I would expect the starting trade into the worlds next big up cycle is underway. Currently, I'm leaning that these trendlines hold and the $USD heads higher.
Good Trading,
Greg Schnell, CMT


