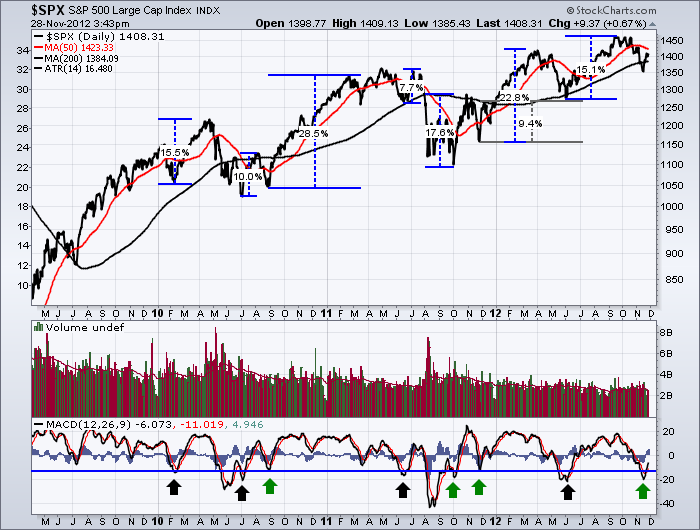
This is one of my favorite methods of analysis. I like to stay aware of the MACD levels relative to historical norms.
The Green arrows represent bounces from this level that happened in the SEP/OCT/NOV time frame.
The black arrows mark bounces from this level at other times through a year.
The reality appears to be that when the MACD is pulled down this far by the investing community, there is usually enough ammunition for a big bounce. The S O N months, have 17%, 22% and 28% rallies from this level.
The other months produced rallies of 15%, 10%, 7%, 15%.
The market has been quite resilient the last 3 days so someone is buying the intraday lows.
Remember to enrol in the stockcharts university classes. The link is on the home page.
Good Trading,
Greg Schnell, CMT


