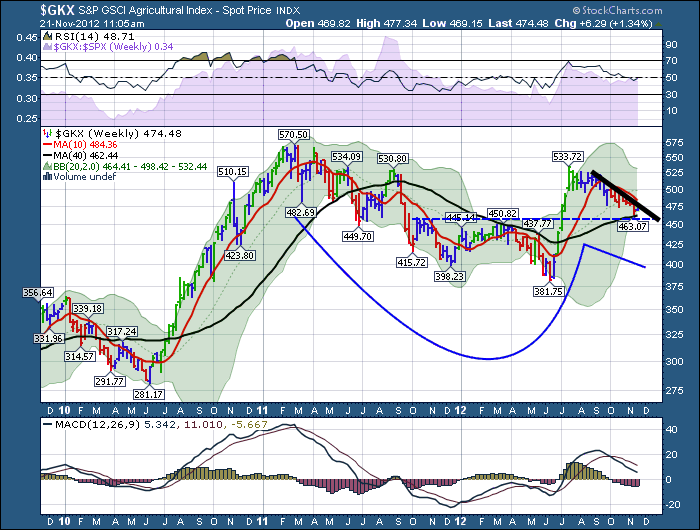
Took a brief tour of the charts this morning and AG pops up as interesting. This chart is a compendium on Technical Analysis.
When we look at the price chart a few great things are happening.
First of all is a gigantic cup with handle. That is good to see after a strong acceleration run on the left side leading into the cup. The right side is a little steep, but the handle is a controlled pullback so that is good. Three buy points are created with a cup and handle.
1) A break above the black down trend line marking the handle trend as part of the C/H pattern. Also just playing a trendline breakout. which is a simple technical trade.
2) A cup/hande buy point which is a pattern based buy point. A buy point above the July high. Would also be buying a fresh 52 week high. Another technical style.
3) A buy point above the February 2011 high or the left side of the cup is the C/H pattern terminology. Also just playing a break out of all time highs. As a footnote, sometimes its the handle that is the high point, sometimes the left side.
Other buy points not related to the c/h pattern.
1) A breakout above the black line would also be a break above the 10 week.
2) The 40 week average is a great place to look for support. Recently it found it there. It is also strengthened by the Blue horizontal dashed line. What was resistance becomes support. Playing the push off the 40 week. An institutional buy point.
Stops could be placed under the 40 week (never right on it) or just below the blue dashed horizontal line at $450.
The multi year target for this trade would be 680 based on a head/shoulders base with a depth of $150. ($530-$380 = $150.) Add the depth of the pattern to the neckline at $530 + $150 = $680.
The MACD looks like it will gently turn above the zero line. That's a great technical trade. Living above the zero line! So, nice trade. What do we need to see to buy it? A clear break above the black line.
Pay some attention to Ag. It appears poised for a move. Don't forget the stops. That $530 has also become major resistance. That is why it is called the neckline...
To all our American readers, I hope you enjoy Thanksgiving with friends and family!
Good Trading,
Greg Schnell, CMT.
PS. Don't forget to enrol in the SCU 101 classes. The link is on the right on the home page.


