The world is married to the $USD as it holds the 'reserve currency' status. I don't know that we say the wedding vows to it, but it is still the main venue when signs of stress appear. Of course, I would not try to link marriage to stress! That is taking the analogy too far. A few weeks back I mentioned the $USD had positive divergence on many charts. If the $USD starts ripping higher, commodity prices go lower. So, let's do a drill down on the currency pairs today.
Here are the components of the Basket.
The Euro, The Yen, The Canadian Dollar, The British Pound, The Krona, and the Swiss Franc.
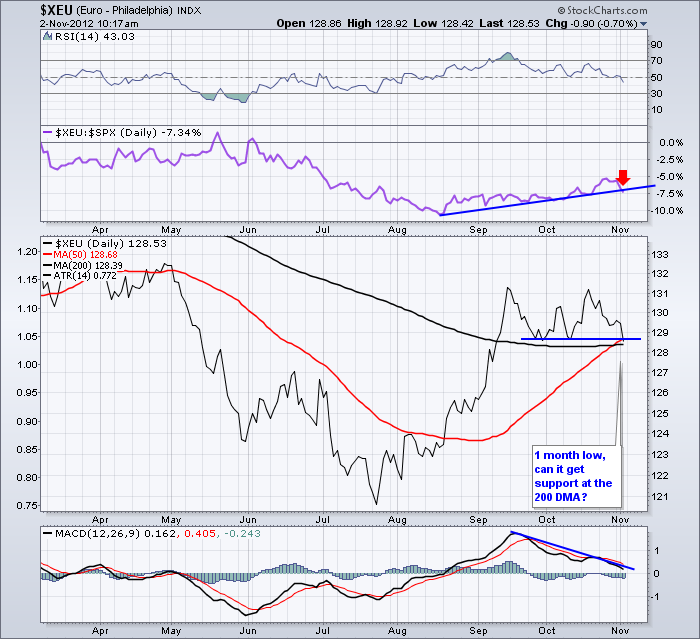
Here is the chart of the $XEU daily.
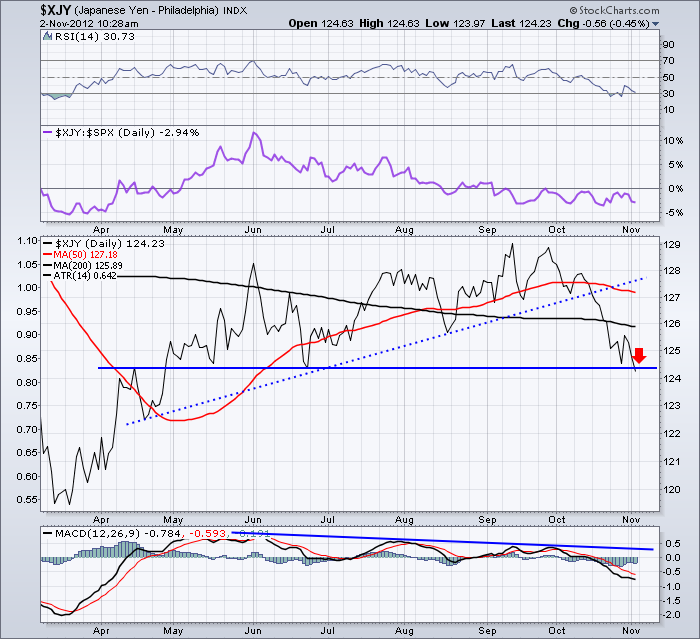
Here is the $XJY
That has been massive divergence that finally released. We had noted the Head/Shoulders pattern on the Yen before it broke down. The inside of the right shoulder of the 2 year H/S pattern was marked by the dotted line. Check a three year chart. The neckline is around 120. If the neck line does not hold, this is a big change. The long term Yen target would be closer to 111. To repeat, that would be after a lot of oscillating. I do not expect a straight line down. But I feel like we could drop quickly to 120.
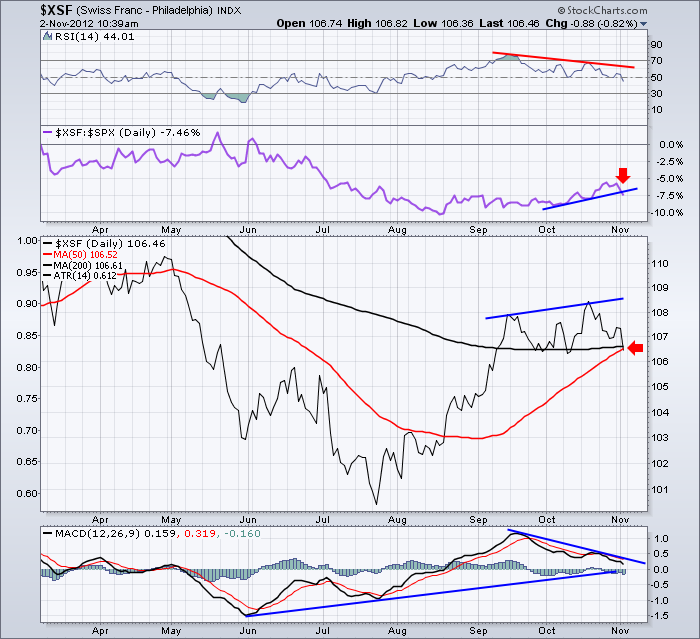
Here is the $XSF. The Swiss Franc. It has major divergence on the daily chart. You can see the SPURS line in Purple has been broken and the price bar is testing both the 200 DMA and the 50 DMA right here and now. Extremely important support area must hold but the divergence looks like that will not happen.
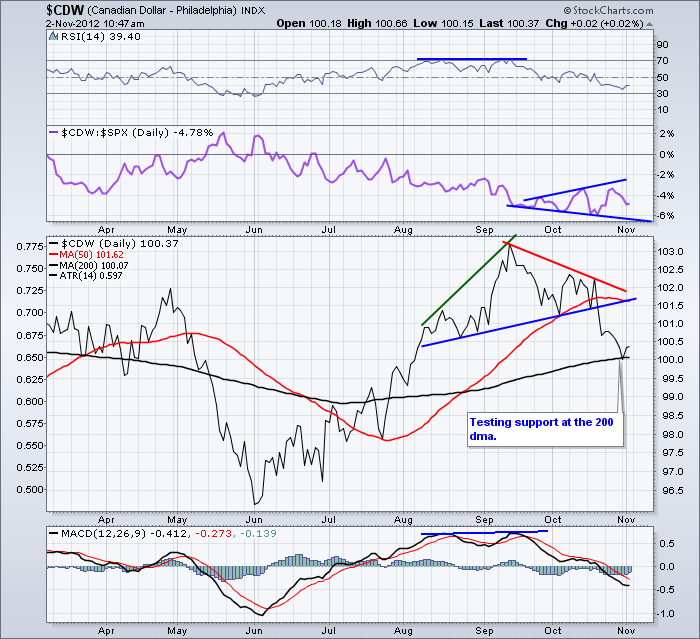
The Canadian dollar is really falling from the major top it built. The H/S measurement says 99.5 for a minimum target. You can see it is currently trading just above the 200 DMA. Lets watch to see what happens here. If the $USD goes on a significant run, the commodities of Canada,Russia, Brazil and Australia will be hit hard. Also, the 99.5 target doesn't mean it will stop there. We will look for some support there as the price wobbled in April and July around that 99.5 level.
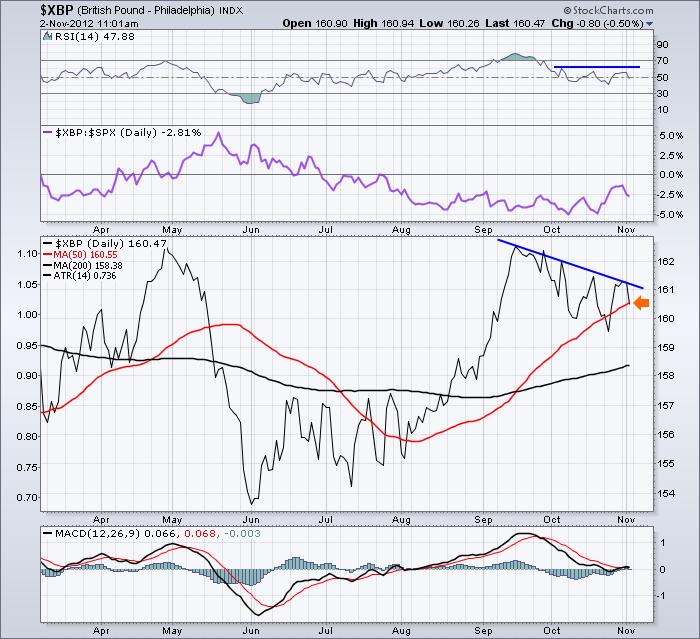
You can see the pound has been in a downtrend. The recent big bounces in price have not shown any strength on the MACD or the RSI. This looks like a continued trend down. One thing on this chart that looks a little better is the SPURS line has broken the downtrend and put in a positive push.
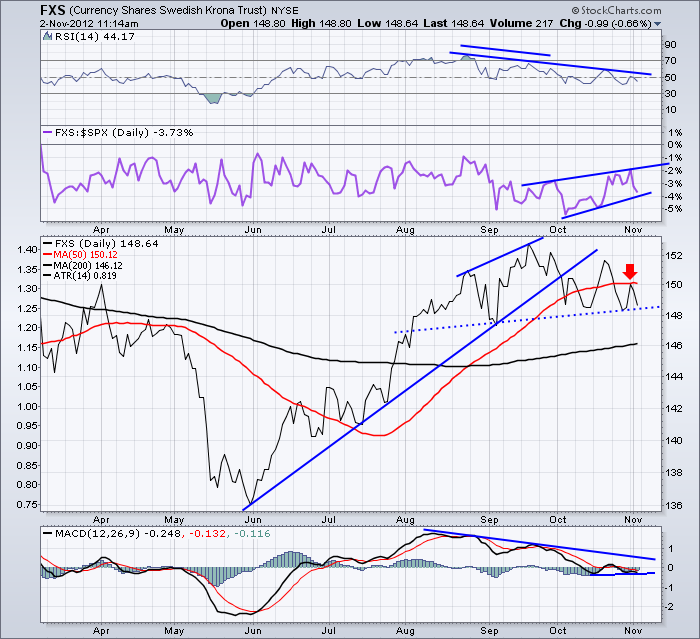
Here is the Swedish Krona. You can see it went through a divergent period. It is now clearly moving sideways at best and looks to be in a downtrend. The 50 DMA in red caused it to oscillate a little but the most recent bounce was not able to get above. There is a tiny,tiny positive divergence at the right edge of the chart, but this still looks like a H/S top above the blue dotted line. A break down below there would be just another push on the $USD higher.
I don't decide on the components of the basket. But it reflects the strongest tradable Asian currency; the Euro, Swedish Krona, British Pound and the Swiss Franc representing Europe; and the Canadian Dollar representing the North American trading with America. You can imagine that the Yen, the Pound and the Euro are the strongest forces.
I want to close with the Daily and the weekly on the $USD.
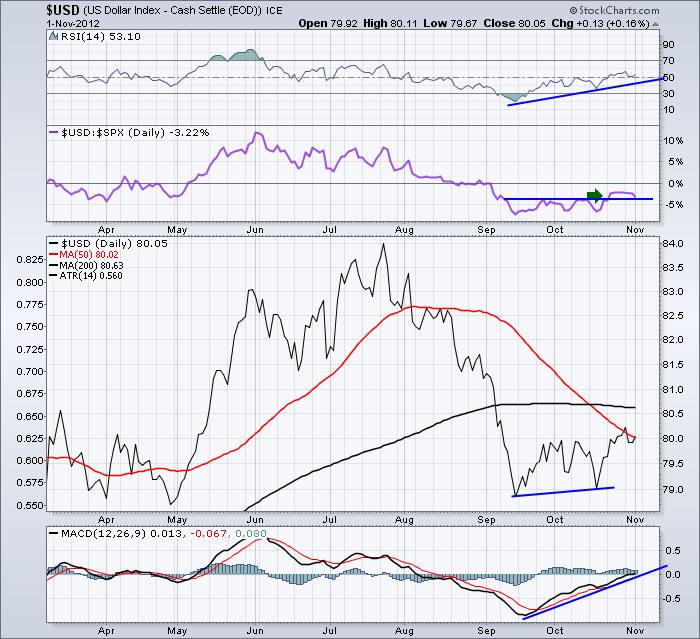
Notice the positive divergence on the daily $USD chart. This chart will not update till end of day.
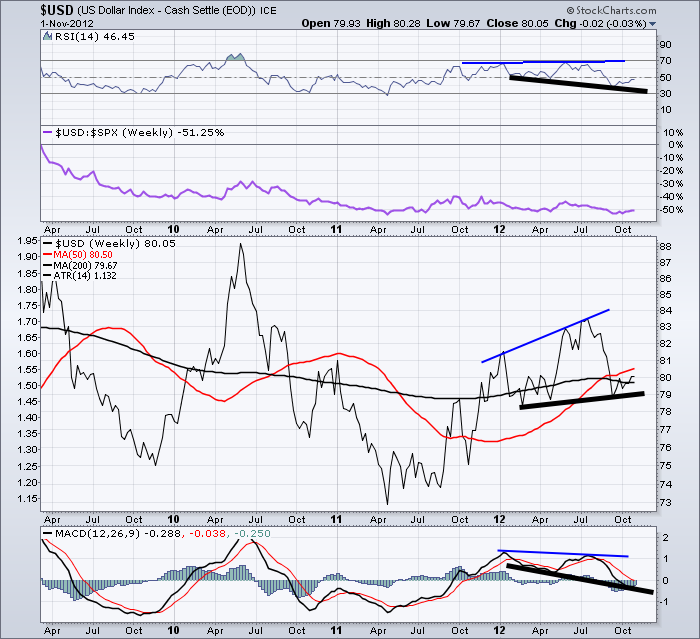
Now, the one chart that is not really showing its hand yet is the weekly $USD. We see divergence saying to the downside.
I notice that it has lots of divergences saying the dollar should weaken. Divergences don't have to play out. I'm going to stick with the group of individual charts making up the $USD and use that as my analysis as it would appear they all have the $USD higher direction in mind. Currency traders are usually the fastest traders. I don't know if that short trading duration is a factor, but the weekly chart may hold longer term clues that ultimately the $USD weakens. That would not be a surprise. But right here, right now the $USD looks to be making a push higher against all 6 of the basket pairs. Being positioned on the wrong side of this trade could be stunningly expensive. As an example, Oil, Copper , Gold, will probably trade lower in a swift fashion as this plays out.It might be best to fall in love with the $USD. But not at the expense of your marriage!
Let me know what you think of this or any other blog articles. I appreciate the feedback.
Remember the Calgary Stockcharts University conference is February 2, 2012.
You can subscribe to this blog by email from the blog section of the website and find the Canadian Technician listed on the right hand side. Look top right within one of the blogs to find the links. I am also on Twitter @schnellinvestor or you can track me on the stockcharts.com facebook page.
Good Trading,
Greg Schnell, CMT

