Now that I have your attention, let me back it up with facts. It doesn't do us any good to look in the mirror and say that we have been in a big bull market since December 2012 when we have missed the move. So lets go risk on, lay out some history, some levels, why now and what would change my mind!
I wrote this blog originally on November 23rd, and have edited it 4 times. I could wait another couple of weeks and the Russian market would probably join in. Anyway, I decided the 2012-12-12 date was a great day to publish it as the Canadian market moved into the bullish area today.
With the price action here, in Europe and in Asia, it would appear that this is building into a more significant move. When the data changes, so must our opinion. That is what makes TA powerful. We have a list of signals we are watching so we can change.
FIrst of all, lets talk about this rally.
1) One of the things I've noticed is : Markets bounce when they have the politicians full attention, not when the resolution arrives. When Draghi announced he would do whatever it takes to save the Euro, that includes printing money. So with all the major markets of the world printing money, we can ride all the coordinated central bank actions. Europe has been riding high for 6 months since his speech.
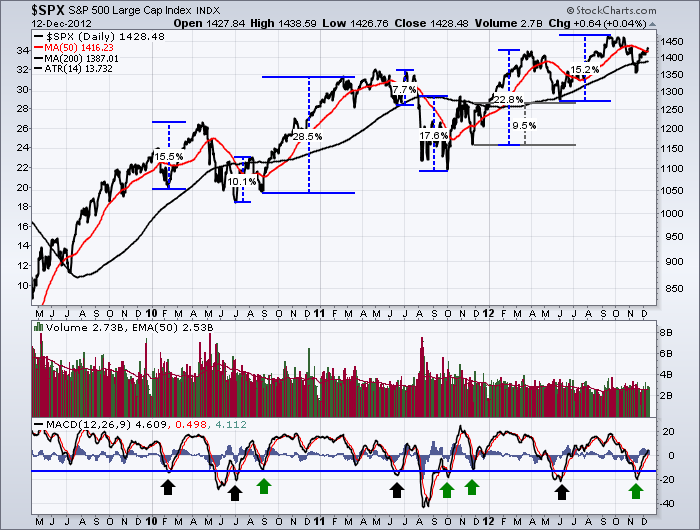
2) When the momentum of the $SPX reaches significant lows, the bounce is usually substantial.
I marked all the MACD (momentum) lows that occur in the SEP/OCT/NOV timeframe with Green arrows. All of them were substantial rallies from this low momentum level. I marked the other rallies during the year with black arrows from the momentum lows at this level. All of them produced strong MACD rallies so that looks pretty bullish.
Now lets look at the broader picture. My line in the sand for a global bull market is when all global stock exchanges are above their 20 Month MA. Notice the green lines on this chart. The mark where the US rose above the 20 month MA. I have another 30 year long term cycle chart that makes a 36 month interval based on crossing the 20 MMA very interesting. You'll find this blog long enough without that one!
Here is a big chart with major global stock exchanges on it.
You can see on this chart above. When the $SPX market is above the 20 month MA its bullish. But my research also says that when the whole world is above the 20 month MA, that is a global bull trend that is usually multi - year. Notice 2003 and 2009 green vertical lines mark the point where the US markets crossed into bullish territory.
Now look at the rest of the countries.
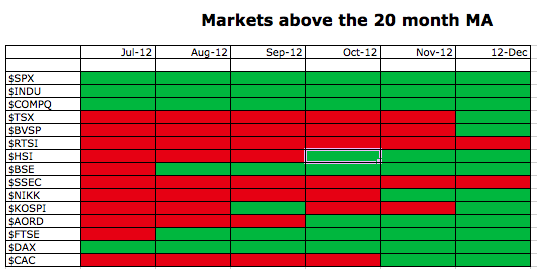
Currently the only major global market below its 20 month MA is the Shanghai. Currently, the $BSE (India), $NIKK (Japan), $HSI (Hong Kong), $KOSPI (Korea),$AORD (Australia), $DAX (Germany), $CAC (France), $FTSE (England) and all 6 of 6 (north and south) American markets (SPX, $INDU, $RUT, $COMPQ, $BVSP(Brazil) and $TSX (Canada)) are above. It is not uncommon for commodities to need an extra few months as commodities commonly lag the equities. While Australia as a commodity country surged above at the end of October ,Brazil has recently moved above and Canada moved above today. This leaves Russia, a large market, as the only significant commodity country below as of today. It doesn't have to move much to make it above.
*Spain is below, but look at the rise so far. This is a minor market. I have it here to monitor the trouble level!
My historical work tells me that when all major markets move above the 20 month MA, you are entering a long term (multi year) bull market. So if we close December 2012 near these levels, that is a pretty bullish change. This positive global alignment has not been present since March 2011.
Below is a table of who is above their 20 Month MA. The last 2 times the whole world moved above the 20 MA together, it created serious moves higher in the markets.
Again, as I mentioned, the Shanghai is still below. Shanghai appears to have completed its bottom. America just turned bullish following their election. The $SPX is up 6 % off the lows and well above the 20 MA. Can the introduction of the new Chinese leader propel the Shanghai market positively? I think it can. It rose 5% in the last week. The China PMI just surged above 50 for the first time in a long time. First positive momentum in 13 months!!! China PMI . If we were charting these numbers we would be excited by that.
I have been a bear, watching the US markets make new highs. I've been in Canada and the markets are still 14% off the Spring 2011 highs!
Some of the best rally starts in the last 3 years have occurred in low volume. Three Thanksgiving rallies in 2010, 2011 and 2012 were low volume starts. The Dec 2011 start between Christmas and New Years was also on low volume. So far, the US Thanksgiving rally has been on low volume. Retail investors continue to be afraid. That can be a sign of a major market bottom. Issues like flash crashes, MF Global, the Facebook IPO, HSBC fines, all diminish the financial market credibility and investors have been concerned.
That is my global MONTHLY market outlook. Lets talk about rotation based on the Sam Stovall sector rotation model. In the early phase of the new cyclical upswing, transportation should start to move up.
1)When I look at the auto stocks, Rails, Trucking and Airlines, they are all doing well. This is one of the first sectors to start to move. The Rails are a little light, but currently above the 50 and 200 DMA. All of them are above the 50 and the 200 DMA lines in their sectors. The MACD on the $TRAN weekly moved above zero this week. The $TRAN needs to break out on the weekly.
2) Materials stocks are basing and starting to move based on emerging markets moving up.
3) Other technicals continue to improve.
4) The number of stocks above the 50 DMA continues to rally here.
5) The Advance decline line is breaking out to new highs.
6) The $CDW chart I posted the other day has broken out which has a very high correlation with $SPX breakouts.
What bothers me? Being on the other side of quite a few technicians. Having the $SPX hitting this firm resistance area right here. Having the market pull back at resistance on a Fed week. That caused a top in September. On the charts above I selected areas on the charts with horizontal support and resistance. The $RUT is at 825. This level has been a problem all year. The poke above in September unwound quickly. Now we are testing it from the bottom side again. I am not bothered by the fiscal cliff. Global trends will outweigh a couple of government tax grabs. This wouldn't be the first time we have had a tax increase from government!
So, I'll continue to watch. Perhaps this all falls apart. But at the current levels, this looks very bullish. Follow along with me over the next few months. If it's true, stop shorting and find great stocks to get long. Should this all fall apart, we can reverse course. At least we have a line in the sand to work against. Right now, I'm bullish. Things can change for the worst, but my data just turned positive. I thought I would share it.
More remarkably, I think I just turned bullish for the first time in 18 months! Its been a long slog!
Monthly candles are long candles. They cover a lot of price levels in a month. This call won't help on 1% and 2% down days, but we are not seeing a lot of distribution days either. That will be a clue for me if this isn't going to hold. First stop is getting the $SPX to hold solidly above the 50 DMA! Today we closed above it again. One of the major issues technically, is the $SPX is currently at the height of the left shoulder in a head / shoulders topping pattern! We need to clear this so it doesn't complete.
So my lines in the sand are:
1) $SPX stays above the 50 DMA
2) $TRAN breaks out on the weekly chart.
3) $TSX stays above the 20 MMA.
4) $SSEC continues to improve
5) $RTSI - Russia joins as well. Hopefully before December is out.
6) Continued upside moves without a collection of distribution days in the near term!
Don't forget to register for the Stockcharts University classes coming up. See the Stockcharts home page. At the Calgary monthly meeting, I worked through a slideshow showing great ideas on using Stockcharts to find better trades in 2013. I heard comments that it was our best meeting ever! Well, there is even more content at the Stockcharts University 101 class in February. Enroll soon!
In closing this 12 12 12 novel, Think Monthly. Think Big Picture. Think Global. Daily swings will come and go. Watch your levels and try to come up with your own conclusions. If all these markets stay above the 20 month moving average it pulls them higher. If they continue to stay above a 20 month moving average we are in a raging bull market. It may wobble a bit here, but watch the globe. The stock markets lead the economic indicators.
Good Trading,
Greg Schnell, CMT.


