I received this question today from a regular reader. It's a great question!
Greg, I read your articles regularly - Arthur's and John's articles as well. Thanks for the great charts and interpretation of them. It has really helped me over the last few years.
I am still looking for the magic bullet trading style though. I've been trading ETF's for years, but wondering about stocks? Is one better?
- C.M., Toronto
First of all, let's discuss the question a little bit before answering it...
The benefit of trading ETFs is that they take the volatility out of the trend because they average individual stocks. You are less subject to management problems, a single company earnings miss, etc. The problem is that you get the average performance and can miss out on high flying stocks that outpace.
One of the reasons the 2x ETFs have been popular is that you can trade their moves with more directional strength. So if you are in the strongest sectors, you enjoy the ride. But if your 2x sector ETF just meanders, you end up losing because of the way they are calculated daily. So poor performance compounds the underperformance.
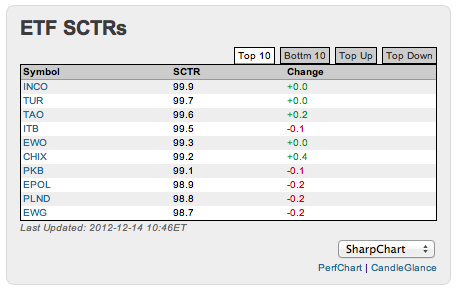
For a relatively new investor, I would suggest looking at the regular ETFs that you can find in the "ETF SCTRs" box on StockCharts' home page. But even experienced investors can benefit from this box. I've found this box to be golden.
By being aware of the strongest ETF sectors every day, you get in tune with the market. New groups pushing up into the strongest list (both the "Top 10" list and the "Top Up" list) can stay there for months. Study those lists frequently.
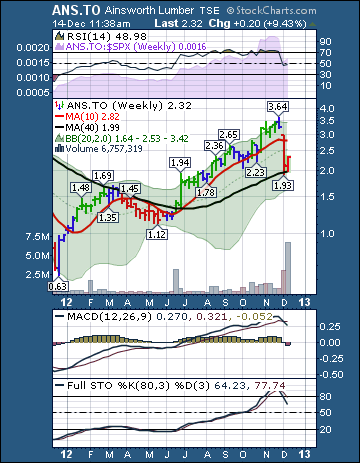
If you want to play individual stocks, and I use those too, then make sure they are in new strong sectors. How do you know if its a new strong sector? Well, you need to use our Sector Summary page which I'll show how to find below. Because you are clicking on the Sector Summary every week and seeing the rotation and drilling down, you'll notice that some things being served up show a new trend. Like Lumber and Homebuilders, Appliances and Realty all moving to the top might show Housing is strong. But then you own Ainsworth Lumber and got hit by a load of 2 x4's last week. (Another example of why I like the ETF better!)
So, when you are watching the sectors, you can also look at performance for the last month, etc. You will see it is Utilities for the last month. It looks to me like things are changing to new bull market mode. Why? You'll see Industrials and Materials on the weekly list.
So, where is this amazing list located? The Sector Summary link is located inconspicuously below the yellow chart box on the StockCharts home page. I would have drawn a yellow brick road leading up to the button saying click here, but I'm not an artist! I am a chartist! So here is a screen clip!
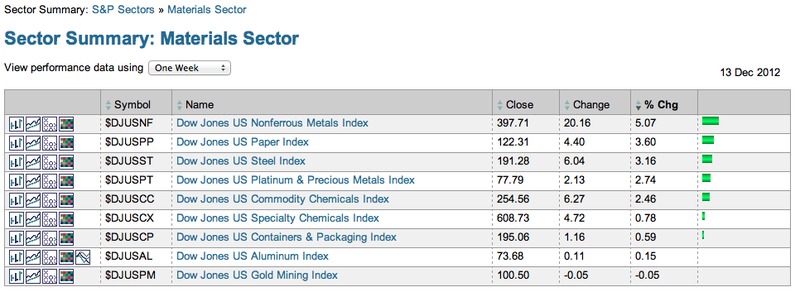
After you click on the Sector Summary link, set the dropdown box at the top of the page to "One Week" then check out the list. For instance, you can see that this week Materials and Industrials are starting to outperform. That should happen in a new bull market.
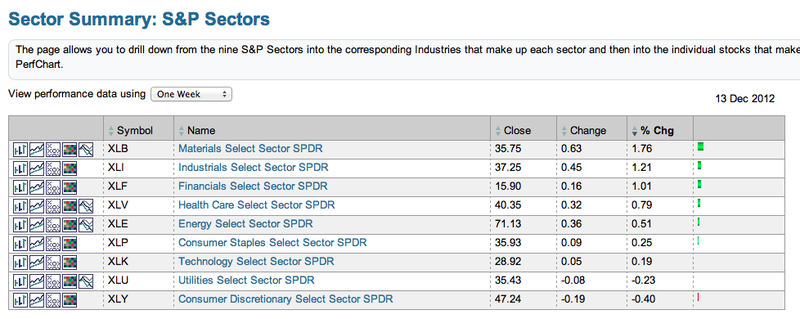
So let's say you like Materials. Go ahead and click on Materials. From within Materials you should see the following:
Click through the top 5 to get a feel for what is going on. Notice where Gold is on this list. Mental note inserted. Avoid the sector till it gets better! 50% of a stocks gain is by being in the strong sector. The reason for this is the market makers tend to work within an industry specialty. So they are market making multiple stocks in Uranium as an example. All the Uranium stocks start to move up as they see the sector performance change. So even a company with no news on the day, might move. Why? Because other stocks within the sector have news on the day and these market makers see the bids moving to other stocks in the sector. Makes sense. In the pit trading days, all the industrials are traded in the pit(or at the post) together.You can imagine how fast the news travelled across pit traders. There is a different pit (group of market makers) for financials, a different pit for healthcare, as an example.
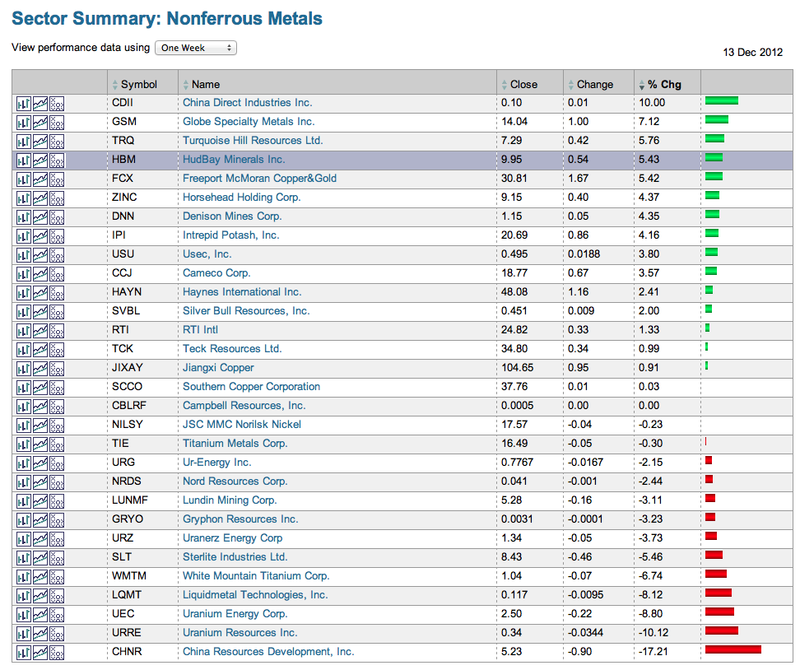
So let's continue. Here is another example, Non-Ferrous Metals:
Currently I own Teck Resources. Perhaps I see that there might be faster profits if I owned HudBay Minerals or Dennison Mines. I click in and check the charts. Dennison and Cameco are both having a good week and they are Uranium. So go check out other Uranium stocks. Now you are hunting..
You can keep filtering. Currently, Turquoise Hill, HudBay, Horsehead Holdings all look better than the Uranium stocks based on this list. I gather Horsehead Holdings is Zinc based on its ticker..you explore here. Gees, I heard Zinc on BNN this morning. Now, go look at the chart patterns. What is breaking out? What has broken out and is moving on up? Which ones do you like and want to enter based on the chart pattern. Seeing any volume? It's near Christmas so volume is hard to find. But I've mentined before, low volume has led the last 3 rallies! Are you more comfortable just trading an ETF?
So you can either invest in a Materials ETF, or pick strong stocks with the sector.
Hope that helps. Let's make 2913 a very profitable year. Let's throw out the losers and ride the winners! Using this approach I outlined above should get you into winning trades more often.
Wasn't sure if you noticed both John and Arthur have just come out with new books on chart analysis and trading. You can check them out on my favorite technical book site, The StockCharts Store.
Finally, remember that StockCharts University classes are full of tips like this. Check out the upcoming classes on this page.
Good Trading!
Greg Schnell, CMT

