The Dow and Transports have confirmed the new highs to validate Dow Theory.
In a small town south of Calgary is a monster size trucking company called Mullen. While the Canadian market has been in a trading range for 2 years (Polite way of saying down to sideways!), Mullen has been continuing to deliver.
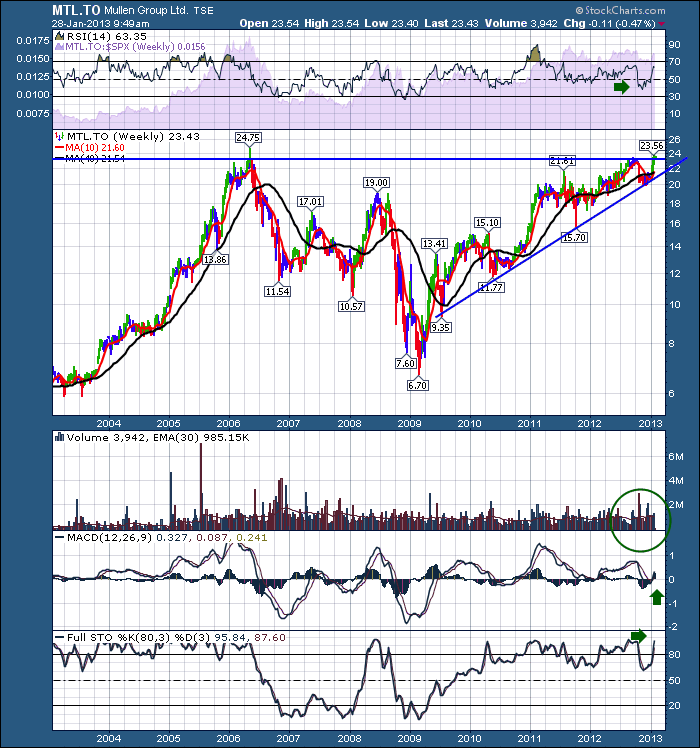
Mullen closed the week out at 52 week highs, and closed above the weekly highs of 2006. It is so interesting that a company of Mullen's size topped out in 2006 when the stock market made final highs a year later. 7 years later, Mullen finally gets to take a run at the highs.
Lets discuss 2006. Mullen's stock price spent almost 3 months stuck under $23.00 way back then in 2006. It only spent one week above $23 and closed at $23.35. Opened the following Monday at $23 and rolled lower. Mullen slid into a jackknife with a low 5 months later down 50%!!! There was a slight divergence at the highs in 2006 on the MACD. This chart is pretty condensed so I encourage you to click on it and adjust the size. As well, even a trend line under the MACD would have helped you time an 2006 exit.
That is a serious flat tire while the broader market went on to Sub-Prime highs of 2007.
Here is the 10 year view. Currently we have the same pattern in price as we dd in 2006. It tested a high, pulled back and made a new high. We closed on Friday higher than Mullen closed that week in 2006. So is it a buy? Well, I like the MACD rising off the zero line rather than making a lower high off the MACD peak like it did in 2006. The RSI bounced off 40 which we like to see. Volume has picked up lately. Stochastics are nice and strong. This all looks very bullish to me.
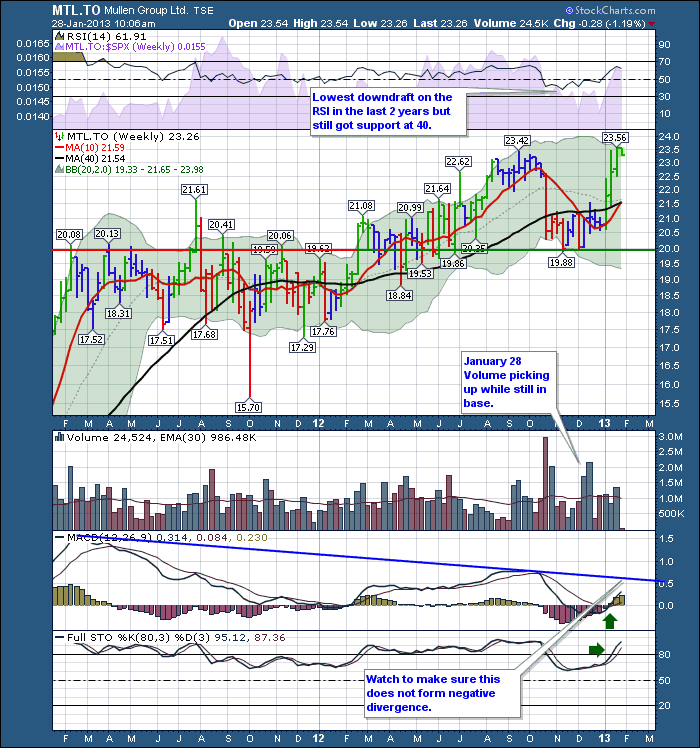
Lets zoom in on the last few years.
This chart has ignored the divergence from the 2011 MACD high.As you can see the stock oscillated a lot, but the general trend was sideways. I like the volume acceleration in the recent base. If Mullen was going to let go, it would make another lower high on the MACD over the next few weeks. If Mullen can continue to make new highs and make a higher high on the MACD this would be a new bull trend. This looks like a breakout to me, closed at new all time weekly closing highs, and the company is in a stong multi year uptrend even though the Canadian economy had slowed down. Imagine how strong this stock will be if the economic recovery ever takes hold! I like it!
The chart is very constructive and it looks to me like this wants to go much higher. Maybe we get a little handle on a pullback but this looks very bullish to me. I will be watching that MACD very keenly. The broader market is very overbought. What that means is the bullish enthusiasm has reached a point where it usually needs a rest. The hard part is we never know the size of the 'rest'! I think the pullback will be bought and we'll watch to see if this market continues its steady march into May highs.
Remember to look for SCU classes coming near you or far away from you. Orlando in February and Long Beach, CA in April. Florida and California sound pretty good as the temperature here is supposed to chill a little in the next day or two. The central part of the continent is really cold! Time to buy Westjet tickets instead of stocks?
Good Trading,
Greg Schnell, CMT


