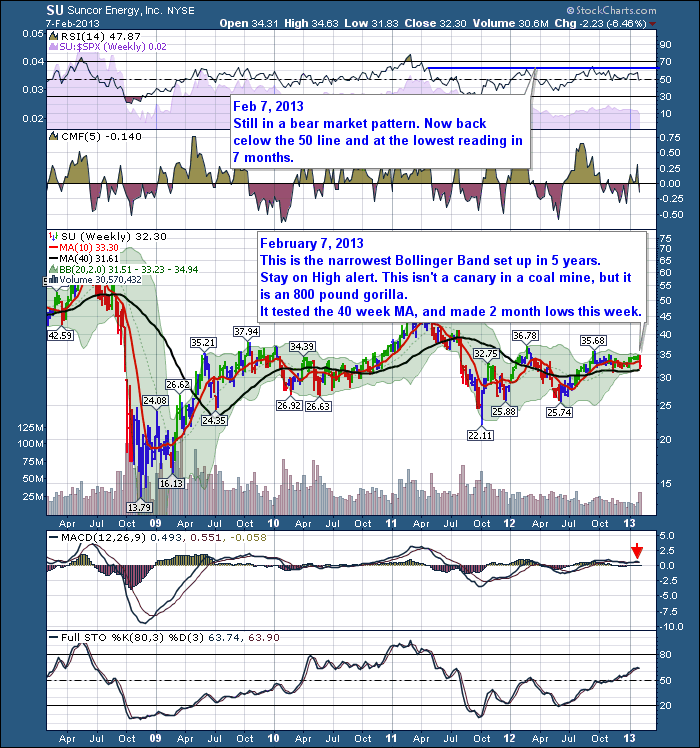
Suncor lost some Market Cap Ore this week. They delivered a 400 ton truckload of news on their earnings and the stock fell hard. One week does not make a trend but Suncor has been trending sieways for a while. Unfortunately, this week looks like a decisive decision on the end of the trend. From the high side to the low side all in a week. We'll see if it continues or if it was a whipsaw. It was definitely a shot across the bow for Canadian Energy Watchers.
The RSI is still stuck in a bearish configuration. CMF is weak considering there has been a 3 month rally in the markets. While this week just pushed the chart to 2 month lows, normally energy sector stocks rally from July to April in 2 spurts. The narrowing of the BB told us something big was going on. The severe price action this week should make investors really pay attention. Bollinger Band compression is usually a strong indicator of a major decision point for shareholders. A 5 year decision point is an alarming point on the chart. The pullback on higher volume is a real problem. The volume clearly snapped the trend of lower volume since October of 2011. While it only reached the highs of last July rather than the previous October 2011, we still have a days work (today) to put in on this chart. Add another 15- 20% onto this candle and its a really big deal. Yikes!
I don't like it when the MACD flatlines just above zero like a heartbeat monitor on a patient. It's never good when it should be in a big uptrend. An upside surprise would be good. We'll continue to see if it can make one. The US oil stocks have broken out, but not the Canadian ones.
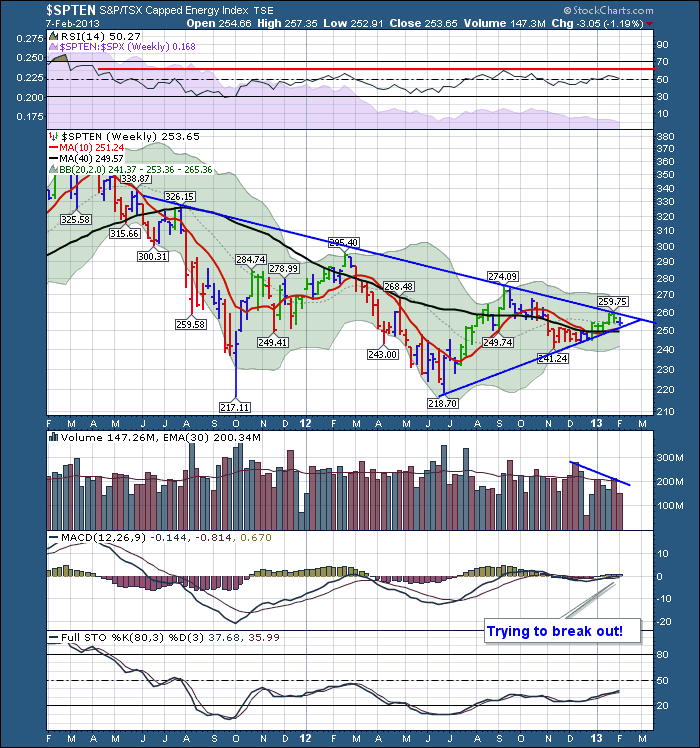
This chart has so much information, and in the broader picture we know the sector is trying to break through a 2 year trendline. This chart break this week, did not help the situation.
Here is the sector chart.
I don't like the fact the Canadian Stocks can't get rolling here. The $SPTMN and the $SPTEN charts are both stuck. So the $TSX remains trapped around that 12800 mark.
Stay tuned. I am visiting Martin Pring this weekend. We are going to have a chart debate all afternoon in his chart room. Martin studies the long term trends and I enjoy his work immensely. When I am back early next week, I'll share some insights as the market sits in this saddle of time. Breaking out to a new global bull market with a few years ahead of us, or breaking down in a classic breakdown as the $SPX wedge seminar talked about? We'll be covering off the effects of Japan, China, the commodity countries, the technology sector, the weakening of the EEM chart, currencies, Oil and Natgas, Gold and Copper to name but a few. Should be rapidfire fun!
Good Trading,
Greg Schnell, CMT


