Today I want to review two charts.
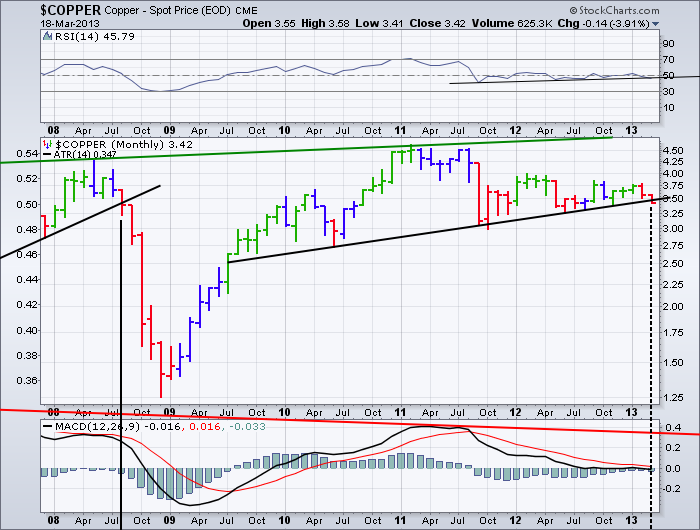
First is Copper. The chart below is a MONTHLY chart. This support area is critical. The huge gap down on a daily chart puts $COPPER on notice as breaking a huge 4 year Head/Shoulders Pattern. Maybe today was a fakeout and this is the place where the markets can rally from. It really is important to watch.
You can just see the major trendline that was in place for three years before 2008 when the commodities broke down. Usually commodities like oil are the last to leave the party but Dr. Copper is usually considered a leading indicator. If $COPPER continues to weaken, its important to be aware that global problems are entering the investing community. $COPPER made its first red candle in 2008 in August as it snapped the trendline. Oil topped in July but didn't fall through the 10 month moving average till September 2008. The $SPX had made highs a full 10 months before.
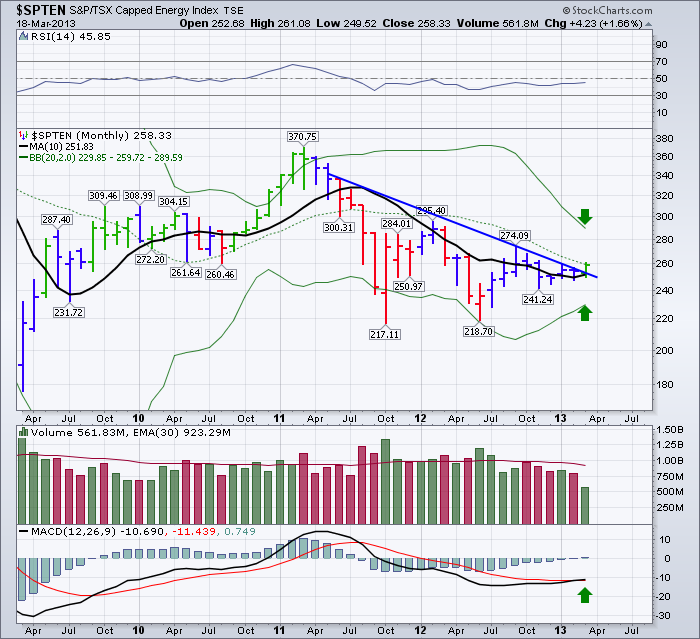
Now look at the current Canadian Energy Sector. The breakout you see occured on Thursday on the daily, weekly and monthly charts. A very important breakout. It seems to be mostly Natgas related but there are some nice charts sitting in the group.
All my other models suggest the US market has to rebound from this recent price action of two distribution days last week, and a day of buying that couldn't finish in the green. The number of stocks falling below their 50 DMA on the $NDX is over 30% now. That's not good. It is a trend I like to watch.
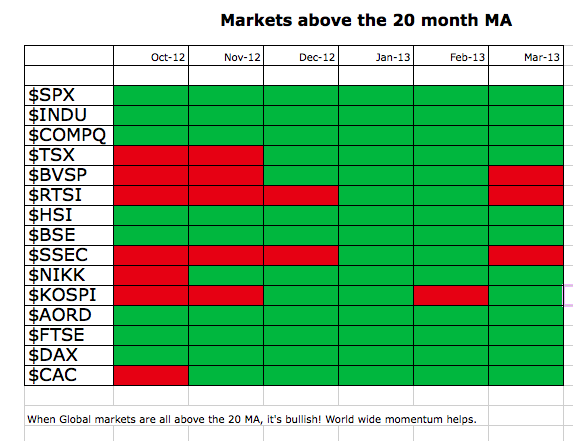
Unfortunately some important markets have lost the major support line on the monthly charts in March so far. It isn't over, but its worth noting. If these markets continue to break down, this will be a failed breakout for a new bull market.
This week looks to be critical in terms of market turning or holding support. If I buy this energy breakout in Canada, I'll be setting a tight stop.
Good Trading,
Greg Schnell, CMT


