As we sit here on the Equinox weekend for 2013, its time to look at the behaviour of black gold.
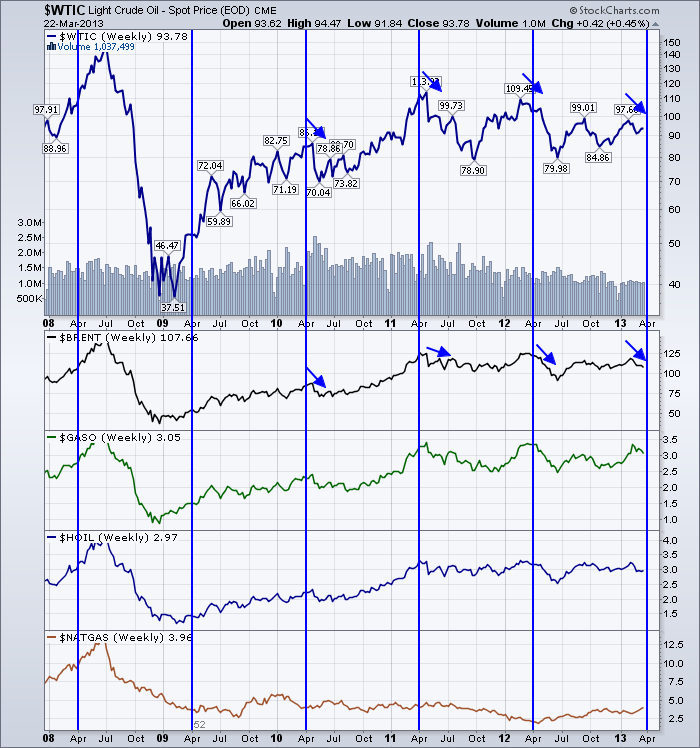
We have multiple ways to look at crude. We can do the futures curve. We can do the spot price. We can do $BRENT. We can do $GASO. What we can not do is ignore the data. Crude has displayed seasonal weakness starting around April 1 for the last 3 years. In 2013, its starting early.
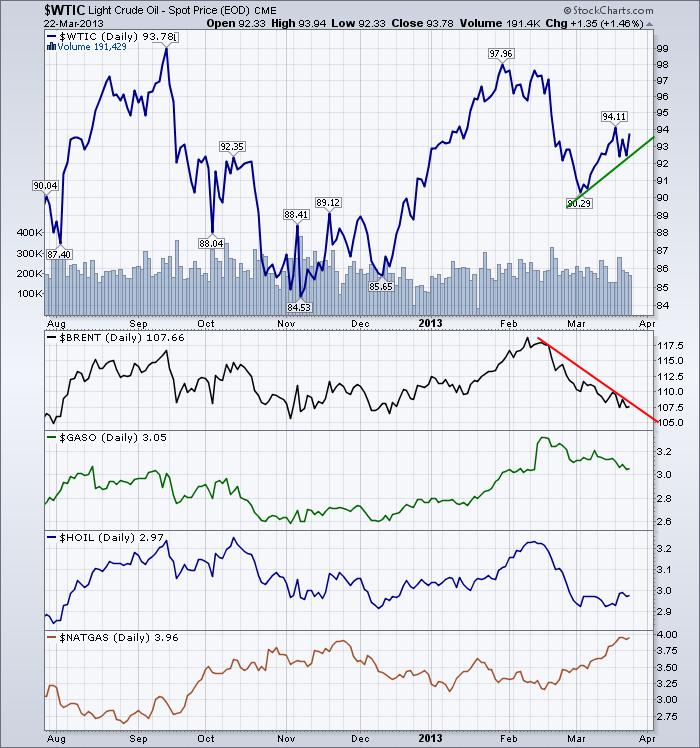
Crude oil started to move lower in early February. Recently in March, $WTIC pushed higher while $BRENT has continued to move lower. Looking up at the chart above, I have placed a blue line at the start of April each year using the cycle tool. What is concerning me is how crude normally continues to make highs into April 1 and then roll over. This year, crude price has faltered early.

I am particularly concerned that the rest of the globe is slowing and that has dragged $BRENT down early. $WTIC has had a recent bounce but it has not affected $BRENT at all. As we have learned over the past few years, $BRENT is the big picture, $WTIC has had more localized affects such as pipeline restrictions.
Considering all the commodities have had a tough first quarter, I would expect some bounce in things like copper even if it is just to relieve the oversold condition. The $USD has been spiking down a few days recently which may also help relieve the pressure on the commodities.
This normal seasonal decline in the oils may undergo some ripples both ways, but I am expecting lower lows getting down to the high 70's for $WTIC before September. You can see on the top chart that $WTIC has tested the high seventies a couple of times in the last few years.
But the heads up is that $BRENT is testing the $105 level which is the lows of the last 6 months. For us to already be near the lows instead of the highs heading into April is why my outlook is more bearish for the price of oils. The fact that both $WTIC and $BRENT could not make higher highs this year over last is also concerning.
Heating oil (diesel) looks more like $BRENT than $WTIC, so we should see lower numbers there too.
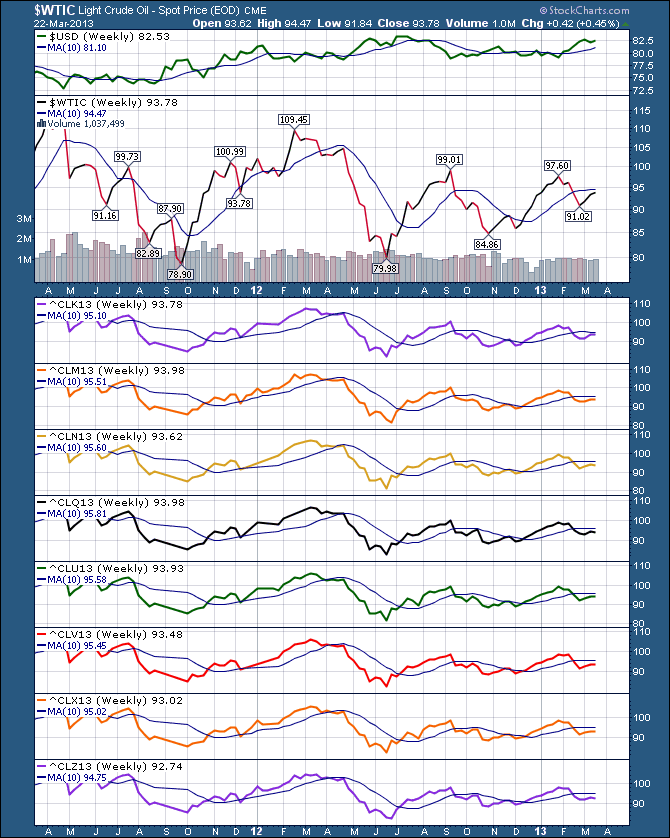
Here is the chart of Crude Futures with months into the future listed.
I don't see the futures curve pointing to anything surprising. As you go down the chart, the months go further out on the curve with December at the bottom. You can see future months over todays spot is pretty much flat. You can see the December crude price is lower than the current spot. The bottom line for me is the curve does not look like a new bull market in demand is near.While it does not show an increase, it also does not show substantially lower prices either.
The market changes daily. Currently, the charts tell me to expect lower spot prices not higher prices based on my interpretation of seasonality.
For more information on interpreting the futures curve follow this link: Interpreting the Curve
Good Trading,
Greg Schnell, CMT


