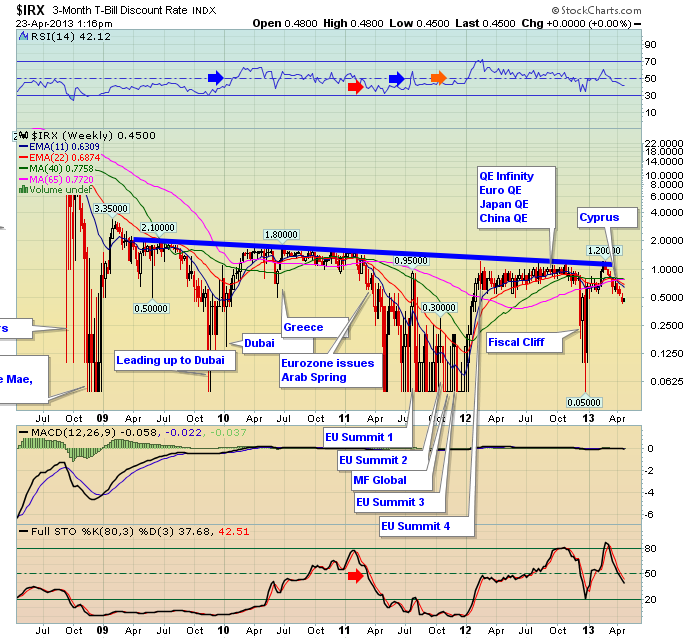
This is the chart of three month T-Bills. When investors are looking for short term safety, they go here.
As they buy, it pushes the yield down. You can see .5 has been an interesting level. This week we have moved below it in almost a straight line down for the past 8 weeks.
I would encourage you to click on the chart and see the large scale. It is my notepad that I write macro ideas on. Some of them never become a problem, like the free parking during the fiscal cliff discussions. But we've headed lower for 8 weeks now after a failed breakout at 1.20. Usually below this level is very concerning.
You can see the Full Sto's have retraced back below 50. The T-Bill /notes / bond markets are twitchy here.
Good Trading,
Greg Schnell, CMT.


