Commodities blow out.
I realize Gold breaking the bottom of the triangle is the big news of the day. As that is pretty obvious, I wanted to review oil as it just blew up on the PnF chart as well.
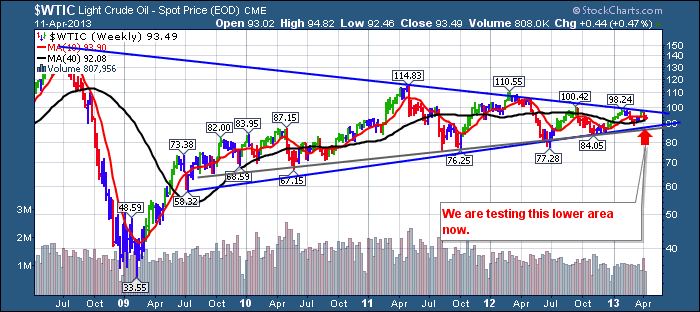
This is the Oil chart which updates EOD. You can see the $81.00 price target has been there before the technical breakdown of support.
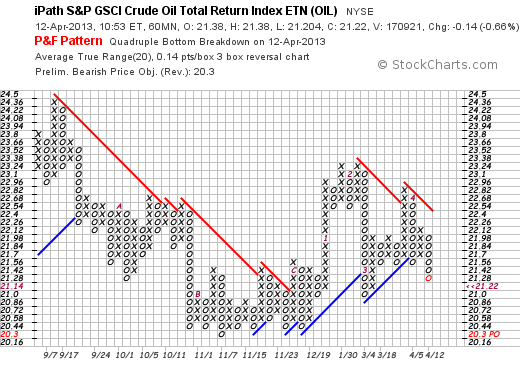
Here is OIL, the ETF.
I had to use the 60 Minute chart to show the breakdown, but here it is.
You can see the target price objective on this 60 minute chart is $20.30 on this OIL ETF. That is down at the support levels of November which is $85 equivalent on the $WTIC chart. (Matching the dates).
Bottom line, commodities let go today which is a continuation of the trend. What worries me most is the big picture triangle of Crude Oil. A breakout through the bottom of a 4 year wedge is significant.It has not happened yet. The longer the time frame of the line, the more important the breakdown.
Here is the Crude oil chart I am referring to. Remember this chart will update end of day. You can see this in the chart title where it shows (EOD) in brackets. As I write this, the actual price of oil is $91.00
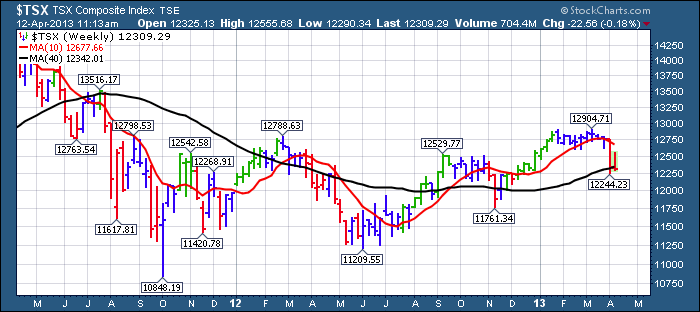
Moving to the $TSX, the 12,500 level on the $TSX chart was resistance. If you look horizontally at that level, it has been significant. This week the $TSX has rejected the price action at that level again.
I'm staying focused on the Huge Head/shoulders chart for the $TSX. This could be the final high before we test the neckline at 11250.(not Shown).
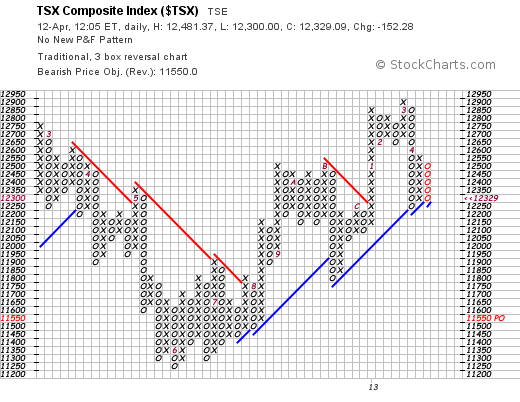
Here is the PnF Daily. You can see the PnF target is 11550.
A break below 12200 starts the red line saying we are in a bear market. A move below 12250 would put an 'o' at the same level as the previous 'o'. If the $TSX moves below 12200, it will put another 'o' which would break below previous support and the uptrend line. Thats an important level.
Just to review, $COPPER is considered an economic indicator. It broke down below a 3 year trendline.
$Gold has now broke down below the 2 year trendline.
$WTIC breaks PnF support. Next area to test is $86, then $76.
There is a trend here so far.
Good Trading,
Greg Schnell, CMT


