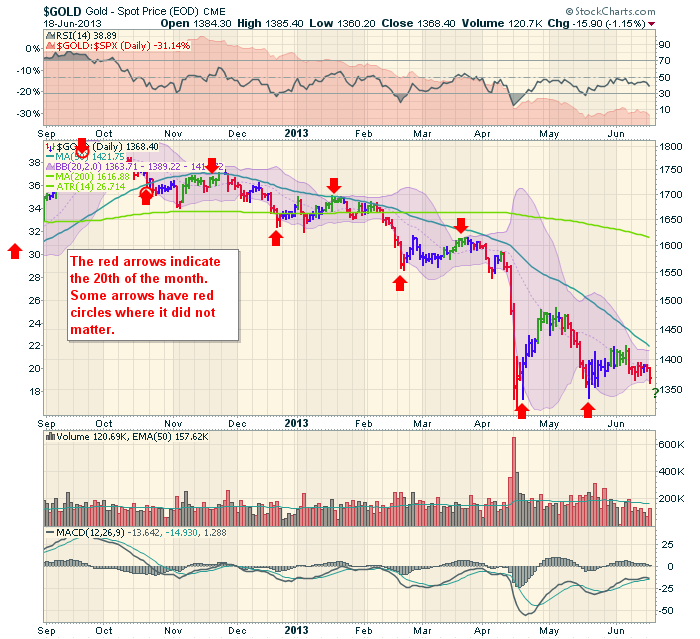
Heads Up...Golden Day is almost here. I have marked the charts up with red arrows since the 2011 top. You will notice that whatever brief trend gold is in, it seems to pivot on or near the 20th calendar day of the month. The red arrows are on the 20th or before if it falls on a weekend.
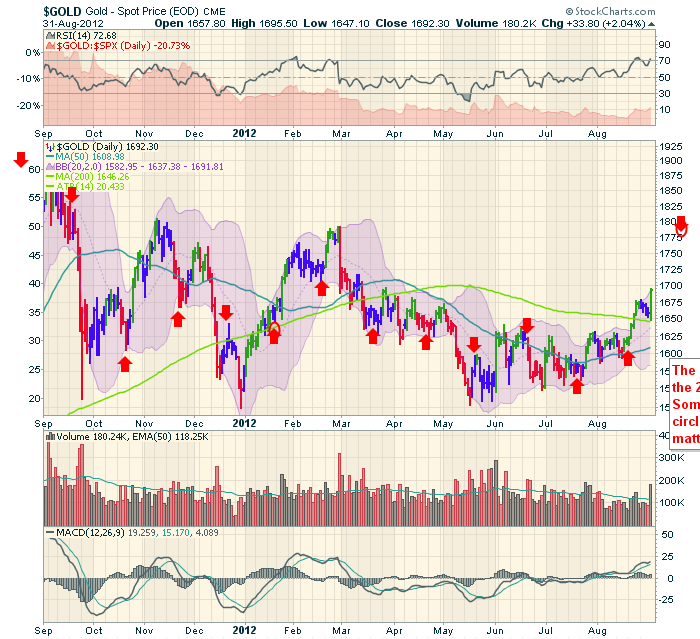
Here is the 2011 to 2012 version.
Something meaningful seems to happen almost every month. A very short term trend change from up to down or flat. A very short term trend change from sideways to down or up. A very short term trend change from down to up or sideways. If you click on the second chart it will take you to a much larger view that you can adjust the size of.
The MACD is still very low so this reverseful could be brief. It also only changes direction 'most' of the time. Remember the bottom chart is last years view and the top chart is current to today. Usually the RSI makes a bounce up off the RSI 40 level before it goes on to break above 50 in a meaningful way. We would need to see the RSI head higher pretty soon (next day or two) if this is marking the final bottom. One positive would be that even though today broke to a three week low, the volume was not significantly higher than recent volume but it was higher than yesterday. It was also well below 50 day average volume. Today's close was just inside the Bollinger Band. The real question for gold bugs is will the current May low be the last bottom before a big breakout rally? You may notice that the May 2012 low in Gold marked the bottom of a move into a September high. Every sentiment indicator says Gold is extremely out of favor. Contrarians would like to think all the weak hands have been shaken out at those extremes. So for bottom seekers, its a volatile place to look for longs. You can see the Bollinger bands are very narrow which usually happens before a big move. The question is which direction? Looking at the top chart, we have a series of lower highs and higher lows. Elliotticians usually denote that as a wave 4 pattern so they would expect one more 5 wave thrust down. You can see the May June July 2012 period in the lower chart had a series of rising lows and declining highs. That ultimately ended up going higher rather than lower. Check the volumes currently on DUST and NUGT here. You can see the bears were not really jumping in on above average volume today, but the bulls traded a lot of shares again today. Should be an interesting week!
Good Trading,
Greg Schnell, CMT


