Trading bottoms in volatile commodities is fraught with risk. Controlling that risk is key to successfully finding bottoms the mature into new uptrends. This is Part 3 of a series of blogs on Gold and related trades.
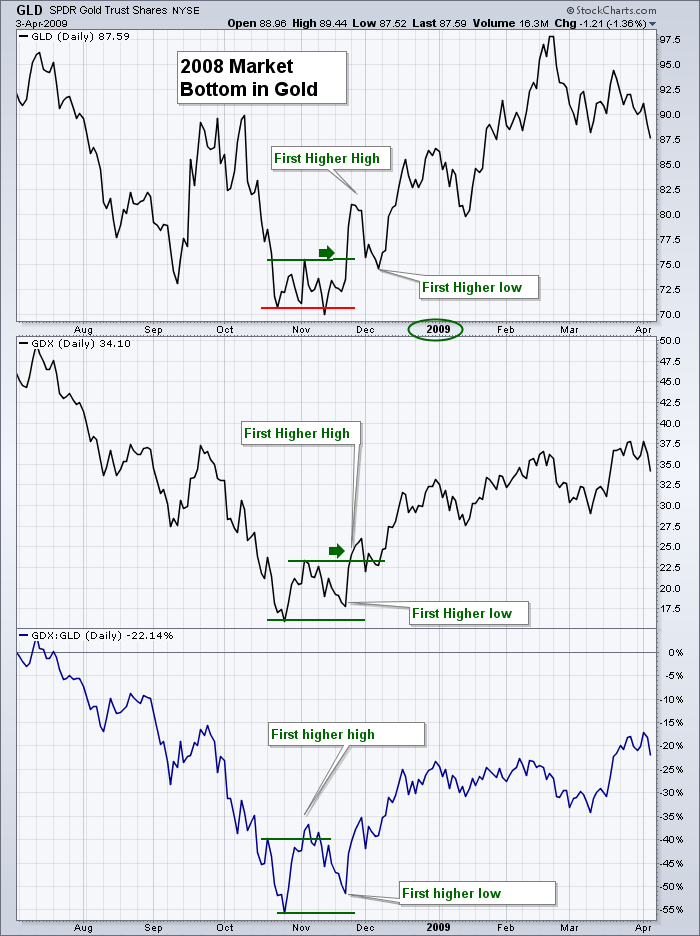
I want to cover the analysis of the Gold bottom in 2008 and then carry that knowledge forward to 2013. Here is a chart comparing the three items back in 2008. The gold ETF, the gold miners ETF and the ratio.
On this chart, you will notice that the GDX:GLD ratio made a higher high first. When it did, the next step in the process was key. Would it also make a higher low or continue the retracement? Well, the late November low was a higher low and then went on to make a series of higher highs and higher lows till mid February. But you can see how they line up.
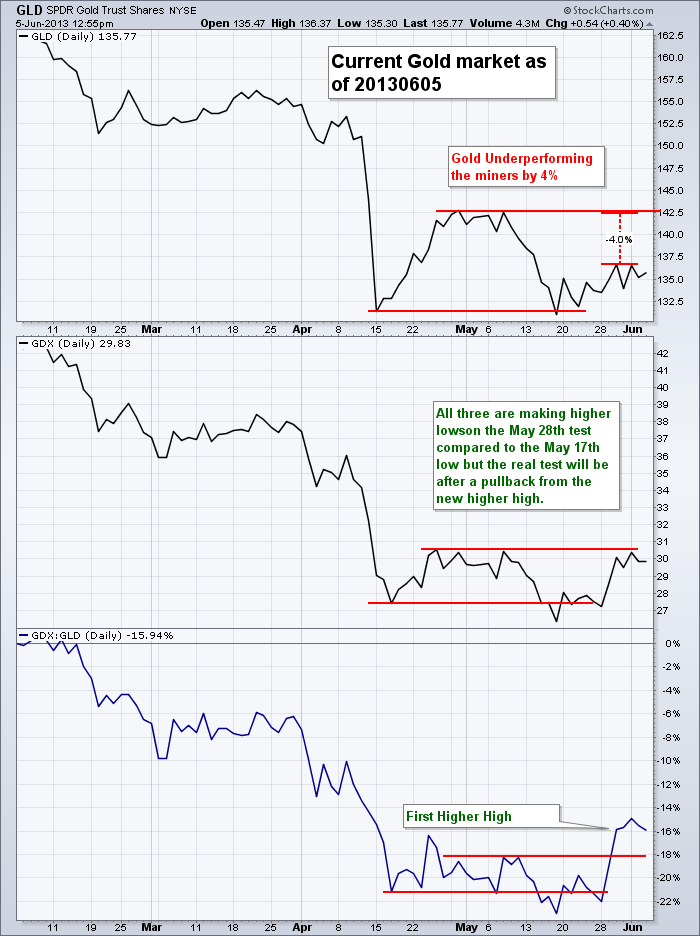
Now look at the current market.
Here we can see the same process starting. The GDX has started to outperform the GLD. We will need to see the results on the next low and some technicians would look to buy in or add to a working trade as it moves to a higher high. This price action would confirm the bottom in my mind.
Let's look at another way of looking at charts relative to each other. We can use the PerfChart.
This is where we can select one.
So add the GDX, GLD tickers in the field and this should be your result. I have selected 'one year' on the slider bar after it opened so it shows 251 days rather than 200 days.
Using a perf chart we can see the downtrend in Jul 2012 was broken on the GDX and started to outperform the GLD by running up faster. This is just visually comparing the two lines at the blue arrow.
So now look at the right edge of the chart. We can see GLD has very minor upslope. The GDX is rising much faster. That is usually a nice way to look for a change in trend from down to up for GLD.
We can zoom in on it as well. If you 'right click' on the slider bar you can get other lengths of time rather than 200 days or the 251 days is a 1 year chart. There is also a 1 month option. Here is one shown below.
You can see the date is for the last month and the number of days on the slider has changed to 22 days. This clearly shows the change in the GDX recently.
Lets look back to July 2012.
On this chart, I have moved the slider back to the July 2012 period as you can see on the dates denoted by the blue arrow. Below, at the red arrow, you can see the space between the slider and the right (Black) arrow of the chart where I have moved it back in time. So this outperformance is what showed up in July 2012. It is starting to show up now.
One of the discrepancies is on a candle chart the price action on GLD looks like a bear flag as Arthur Hill wrote in his blog. The fact that the miners are outperforming leads me to believe it is probably starting a new uptrend. But we need the confirming outperformance once price pulls back.
Some traders only feed on strong stocks. Others like to try and buy the lows after markets collapse. This Gold trade would be considered the latter. One of the things that happens when GLD is starting to rise is we see the GDX outperform. So if you are interested in playing GLD's rise, you might get better percentage returns buying the GDX Gold Miners ETF instead as it usually goes up faster than GLD at bottoms. At market tops, GDX starts to underperform GLD as we saw in the earlier blogs.
Tomorrow we will look at the Bullish percent index for gold miners and see what it is telling us.
Good Trading,
Greg Schnell, CMT


