Point and figure charts are really interesting charts. When they oscillate between a channel or a given range, no new signal is created. In order for a PnF chart to create a buy signal, it has to mke a higher high. It will not kick to a sell signal until it makes a lower low.
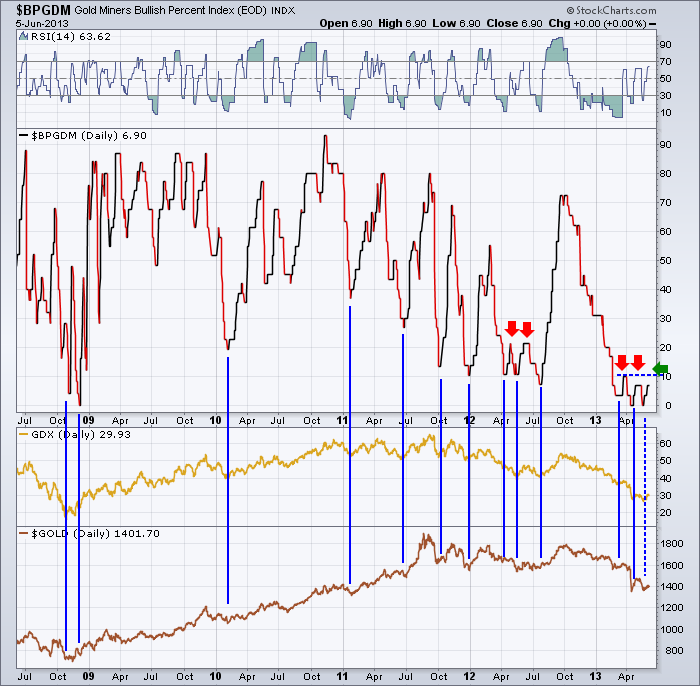
Bullish Percent charts are a summary of individual Point and Figure charts. In the case of the Bullsih Percent chart for the Gold Miners Index, Stockcharts use 30 companies to make up the index.
When none of them are on a buy signal, the Bullish Percent is 0. Currently only 3 are on a buy signal which is 6.9%. Historically, almost every rally from very low lows on the Bullish Percent chart was met with a strong rally. Recently, we have encountered two periods with false breakouts, only to turn around and fail.
You can see in the 2nd quarter of 2012 that it took three trys to start a meaningful rally where all previous rallies from extreme lows had great rallies once they turned higher. Currently, we are in the same situation. I would suggest we need to see the $BPGDM break above the 2 failed highs to add confidence that this rally will get rolling. This would mean that 3 more stocks in the group have to break above previous highs in order to really start the lift.
I am very interested to see how $Gold trades after the 8th of the month. There seems to be an 'end of month' cycle that pushes gold up across month end and through to the 8th of the month when I've gone back and reviewed daily charts. My caution will be intact until I see the price rally through the end of next week. It is something I've noticed over the last few years. It does not happen every month.
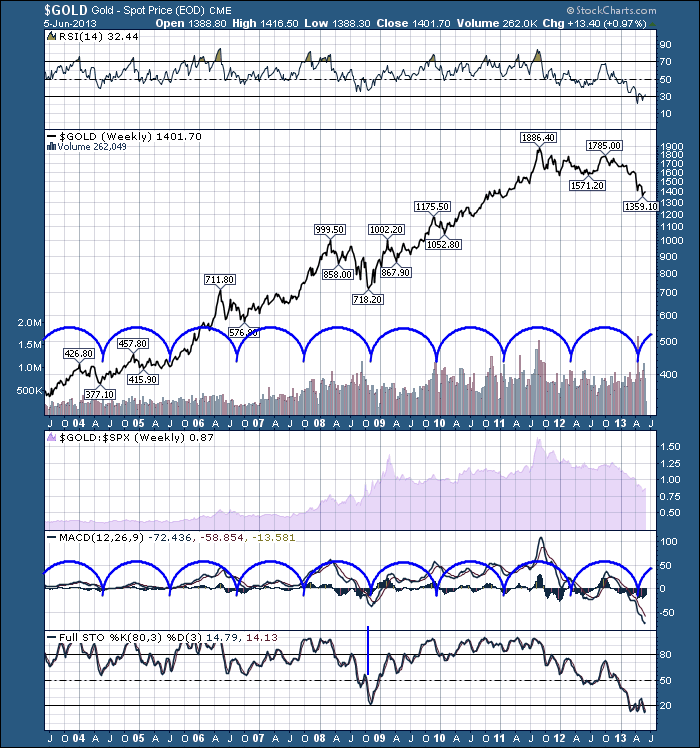
Here is a longer gold cycle.
You will notice that the Full Sto's have been hovering down near 20 for a while now. They are definitely weak and currently testing the lower edge of the range. While this Full Sto line never stays as a base for much longer than 6 months, we have seen all kinds of record moves in this market. The bear is not over until its over.
To summarize, the cycle is due to turn up. The $BPGDM is still making lower highs. While it can't make lower lows it can keep dropping to pull the newest stocks down to PnF sell signals again. The higher lows on the ratio charts shown Wednesday in Part 3 are the next test of faith.
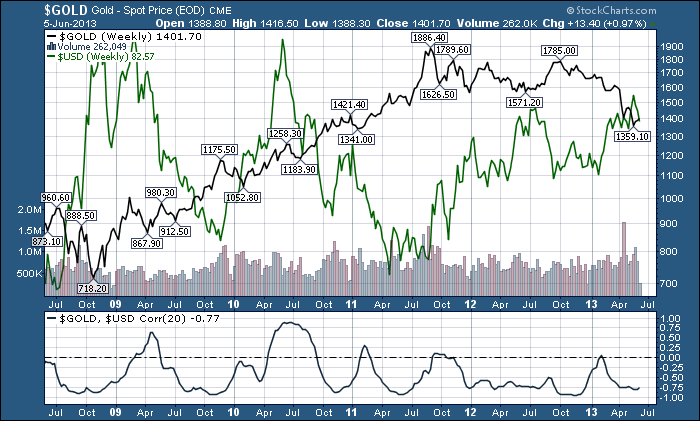
We get into the currency analysis as well. I have covered the currencies pretty extensively. They have a dramatic effect on commodities. The $USD will be a driving factor in the success of this breakout. The strength of the $USD has obviously helped crush $GOLD. When the correlation is +1, it means they move together. When the correlation is -1, they move opposite. You can see $GOLD moves opposite to the $USD the vast majority of the time.
With the strength of the $USD, $GOLD has its work cut out to break higher.
In summary, the bottom line for me is $Gold looks ready to move higher. The reality is it hasn't moved enough to finish flipping all the signals to buy. If you like to trade bottoms, this ones worth watching. If you like to trade charts above the 200 DMA this won't be in your wheelhouse for a while. If you like safe easy trades, this one has more pain than most are willing to absorb.
Good trading,
Greg Schnell, CMT


