I recently listened in on Guy Adami. He made a great comment. "We are not staying here." He stated the market is either going quickly higher or quickly lower. I think a lot of technicians feel that way.
Let's zoom in on the $TSX.
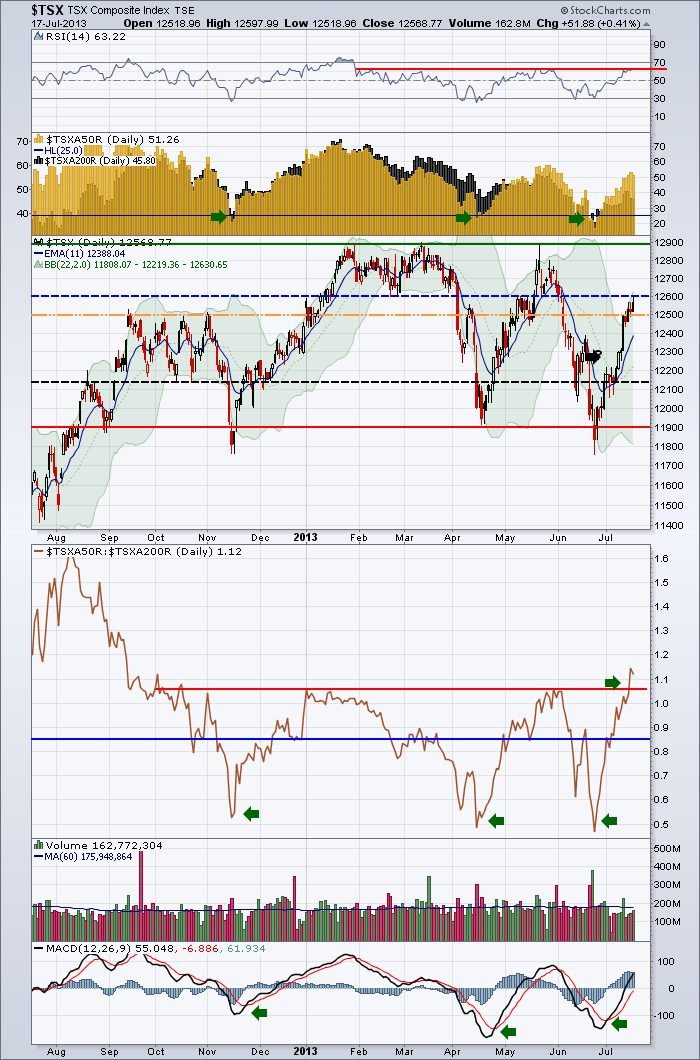
Let's start at the top. The RSI appears to be stuck in a bear market. Oscillating between 30 - 65 is bearish. If you look at the $SPX you will see it gets support at 40 and continues above 70. So this is bearish. The RSI usually needs to test the 40 level before going on to the 70's. But it doesn't have to. The bottom line is we are at a decisive point on the RSI in terms in trend.
You can see the $TSXA50R is moving up faster than the $TSXA200R. That is bullish and we like to see it. You can see the peak in May rolled over in a classic bear market rally.
Lets get to the price action. I have marked 5 lines on the chart. I have used different colours for the purpose of narrating the chart.
Let's start at the green line at the very top around 12900. This area has been resistance since the beginning of the year. The last test was a single intra day stab. Really, a severe level of weakness there. WIth the price action of the miners and the energy sector, it is impressive we have been able to rally that much.
The dotted blue line was support for the previous tops. As the market tested 12900, it would pull back to 12600 and then try to go higher. So this was former support, now resistance. The gold line at the 12500 level has been so important for the $TSX on a long term chart. The line was serious resistance in the fall of 2012 were it spent months up against it before it was finally able to push through. We have pushed above it now which is bullish. But we have found the 12500 and 12600 levels to be difficult in the past. Here we sit this morning trying to push through again.
Next is the black line at 12150. This was the resistance level that we needed to push back above after making a bottom. It was support last fall but if I had a bearish outlook, I would say that level keeps getting broken. So what was resistance should become support for us now. It seems to be a level where the market gets more bullish above, so that is important to watch.
Lastly the red line at 11900 is important. That is the neckline of the head/shoulders top. Recently we broke below and then surged higher. Lets say the 11800 - 11900 area must hold as support.
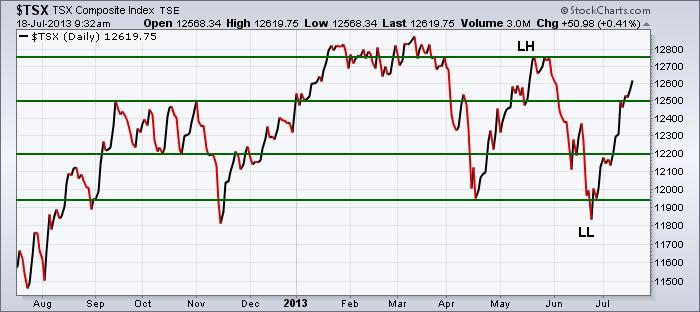
The wide view is that the $TSX has gone nowhere in the past year. We have been in a sideways channel wearing out the bulls and the bears. I would say the chart looks weak currently as the right edge of the chart is showing lower lows and so far ... lower highs. Below is a solid line view without the intraday peaks and valleys. If the $TSX was to fail, this is the area we would expect it to fail at.
OK, lets get back to the chart at the top. The $TSXA50R:$TSXA200R is on a bullish breakout so that makes me want to buy, buy , buy.
The volume in July is typically weak, but the volume on this uptrend has been very mellow. We would like volume to confirm the push by getting more buyers interested.
The MACD has bullish divergence. The price made a lower low but the MACD made a higher low. Good news there!
In summary, the RSI says we are still in a bear market. The price action is making lower lows and lower highs. The MACD shows us bullish divergence. The seasonally weak volume is usually difficult to gauge. No exception here. The ratio is breaking out bullish. This is where confidence really needs to show up. It needs to push price above the May highs and the March highs to really give us confidence it is going to break out. The US Fed is very worried about deflation and that would affect Canada.
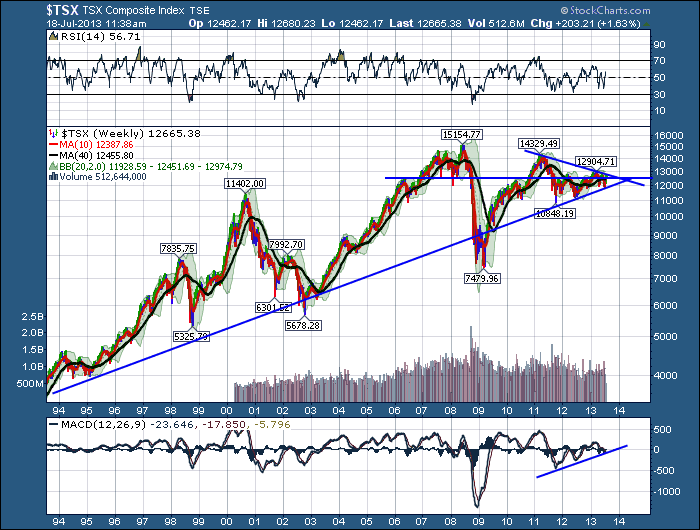
Here once again is the long term. You can see how important this 12500-12600 level is.
The uptrend over 20 years has been supported on this line. The violations in 2002 and the 2008-2009 were big but they gave great buying opportunities. You can see the 6000 level was very important in 2002. The interesting part with that test of the line was the US markets were really falling hard into those lows. Then in 2009, the 8000 level was a great support resistance line. '98, '01,'02, '04,'08, '09.
For the bulls, currently we are above 12500. For the bears, we are making lower highs. Stay tuned as the US market looks strong enough. The Asian markets and European markets are not as strong.
I'm staying bullish. We'll see how earnings season options expiration on Friday affects things. I will be staying nimble.
Good trading,
Greg Schnell, CMT


