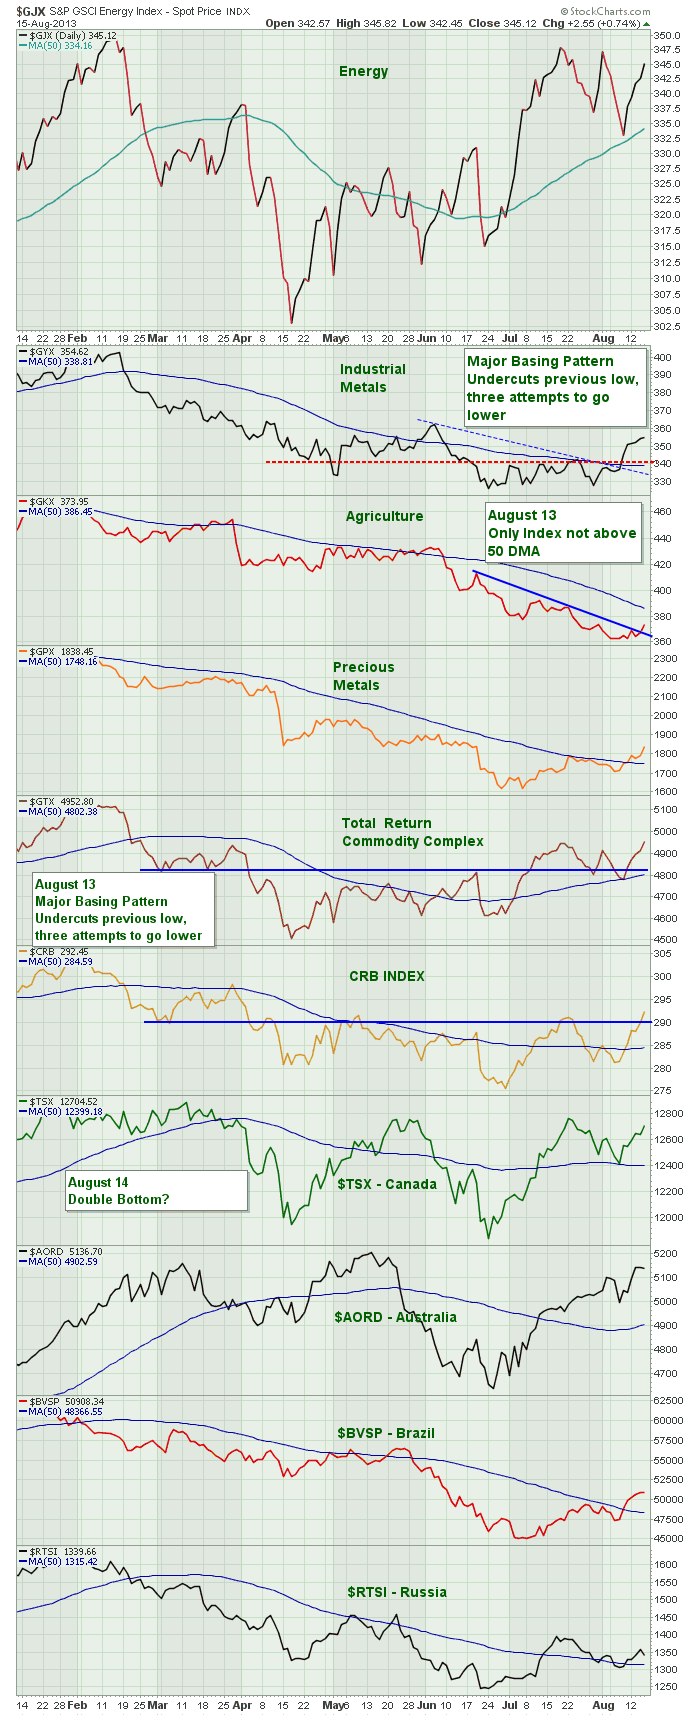
First of all, let's reload the updated commodity chart covering off today's updates that I hinted at in the $USD blog yesterday.
First of all, lets do a high level scan to just see where everything is relative to the 50 DMA. I only see one sector / index below the 50 DMA. That is agriculture. So that is very positive. Almost everything above the 50 DMA. That's a good start.
Now, lets look for higher highs and higher lows. The top chart, energy has taken out the April 1 high, so that is bullish. Over the last few weeks, it has started to make lower highs/ lower lows on a smaller scale. We currently are trying to get above February's top. So some resistance overhead, but we haven't pulled back sharply. Support around 330 - 332 needs to hold. I'd still be bullish as it looks like it is bull flagging. A break below the 50 DMA and 330 support would switch me to bearish. So far bullish.
The industrial metals still have not made it above the April highs or June highs, so at this point it is just a rally within a downtrend. It has broken above the basing area at 340 so that is bullish. I'd still record it as a series of lower highs. Bearish but improving momentum.
The Agriculture chart is still making lower lows and lower highs. If there is one bright spot, it turned up a little today on the big down day. It has broken the very recent downtrend line. Still LL and LH. Bearish.
Precious metals had a big move up on a very big 225 down Dow day. So this chart has broken above recent consolidation at the lows. It took out the July highs, and it is still in a short term rally. A very aggressive sudden spurious spontaneous rally. Very short term optimistic HL and HH. So far we are above last month after making a higher low. Bullish. Cautiously optimistic.
The $GTX has moved above the low consolidation area in July, pulled back, made a HL, and has made a subsequent HH. Very bullish in my books. Just below another resistance level of the July and March highs. The recent low tested support at 4800 and held. Bullish. HH, HL.
The $CRB is similar to the $GTX. Today the $CRB pushed above previous highs. HL, HH. Very bullish. Oil is 39% so with the $GJX at the top of this chart so strong, the rest of the commodities are starting to move. Notice that even though energy didn't push to new highs today, the $CRB did so other commodities are improving! Bullish.
Canada had an up day today on the strength in the materials sector. We are still making lower highs but this recent bounce off the 50 DMA made a higher low at a good support level like the 50 DMA. An optimist might like to use the Mid June wedgie as a high to beat, but it was just a bounce on a downtrend. No real sustained uptrend to create that. Still lower highs though. Indecision, but a breakout above the 12800 with a close there would be bullish! Still bearish until that happens.
The Australia market is interesting. It failed after making new highs in May. It fell down to a lower low and is currently trying to make a higher high. This is a broadening indecision pattern. If it could make new highs along with Canada's breaking out to successful new highs, that would flip me to very bullish. Currently with a lower low as the last turning point, its bearish.
I would say Brazil has made a higher low. The HH is more recent as it has moved above the final blip it created before bottoming and it has moved above the 50 DMA. Now that it has moved above the July high after making the higher low, we have to switch to bullish on this chart. I would record it as a HL and a HH. New Bullish move!
Finally, Russia has a HL but not a HH yet. Bearish.
So when I add them up; 5 bullish, 5 bearish. The $USD at a major decision point. But let's celebrate that commodities are trying to move higher. This is a real 'be nimble' time. If the markets roll over hard because of the bonds, this recent move in commodities could collapse as well. But right now we are at centre field trying to move the ball into the offensive zone.
If we get some global push from Europe and Asia it could be quite a thrust to year end. The charts are starting to encourage me. If the $USD breaks down, the EEM chart should start to run as well. Guess when EEM topped. Same time as the commodities. Spring 2011. When did the $USD bottom? Spring 2011. If the $USD chart breaks (I actually want it to, but don't think it will), I would expect to see a money push into Europe, into EEM, into commodities and into Asia. The commodity countries will probably push higher quickly.
I'm watching both directions for cash deployment or cash conservation.
Good trading,
Greg Schnell, CMT


