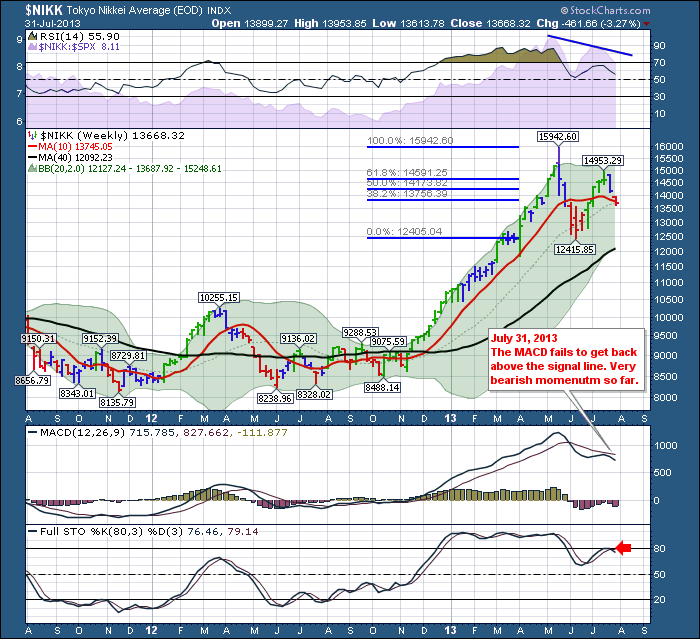
After a parabolic move of around 100%, the $NIKK has had a small 20% retracement. The question after the retracement is what's next. Let's roll through the $NIKK chart to see what's in the charts.
The Nikkei Chart has a few major hurdles ahead.
1) It needs to find a new group of buyers to really give it the thrust. So far they have not shown up. As for volatility, this is volatility in action on a major exchange. In two weeks the chart lost over a 1000 points.
We can see the RSI has made a lower high and we are testing the low in the next few weeks. The price managed to retrace slightly more the 61.8% but closed the last green week at the 61.8% retracement level. Now the price is testing the 20 WMA and the candle looks weak after gapping down from last week. Overnight the Nikkei had a positive close at 14005 and this chart will update EOD. End of Day. So it will close above the 10 WMA and the 20 WMA but still down from the previous week. It is just a very important place on the chart for trend change. The full sto's failing at the 80 line and giving a negative cross on the weekly is definitely bearish.
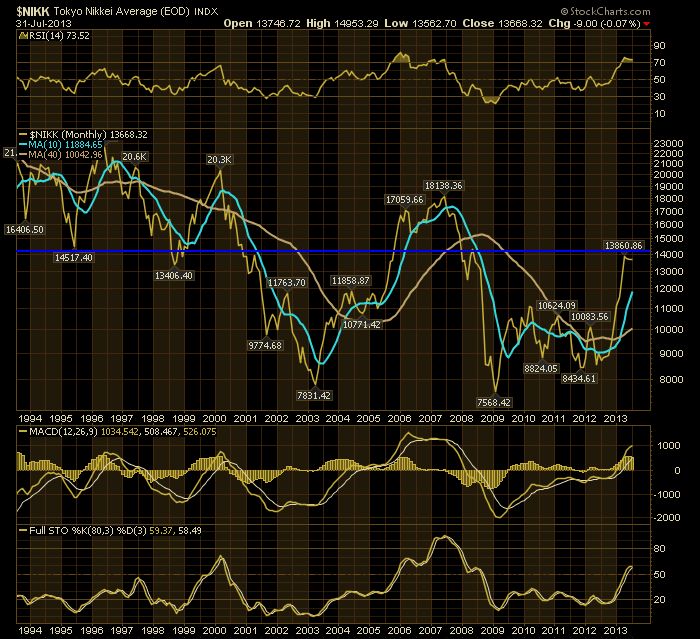
We have a lower high in place and a higher low. The end of month chart at 14000. Decision time for the $NIKK.
The monthly chart stills shows lower highs and lower lows on the big scale. This 14000 level is clearly a hurdle. 1995, mid 1998, 2001, 2008 and now May, June and July have all been resistance or support at this level.
Japan will be important. The JGB bond market and the $NIKK are both extremely volatile right now. A rise in inflation is what Japan is trying to engineer. The hurdle is to do it without creating a rise in the interest rates as Japan already pays more than 25% of their annual budget to interest.
The one thing I see on the monthly chart is Japan has had significant upthrusts before. 1995, 1998, 2003, 2005, 2009 and now 2012. All of them resulted in sideways movements of 6-12 months or quick rollovers. The good news is the $NIKK is above both the 10 month and 40 month MA's. The bad news is traders like to lock in profits as a chart reaches resistance levels. Bear market rallies are usually sharp and powerful. This one has been no exception. A weak Yen is a friend to exporters and a hurdle for import costs like energy. Whether the Abenomic model can continue to power higher prices is a great question but large institutions are probably not enjoying the volatility. Committing more funds in this volatile market will be difficult. Usually funds reduce position size in volatile markets.
Good trading,
Greg Schnell, CMT


