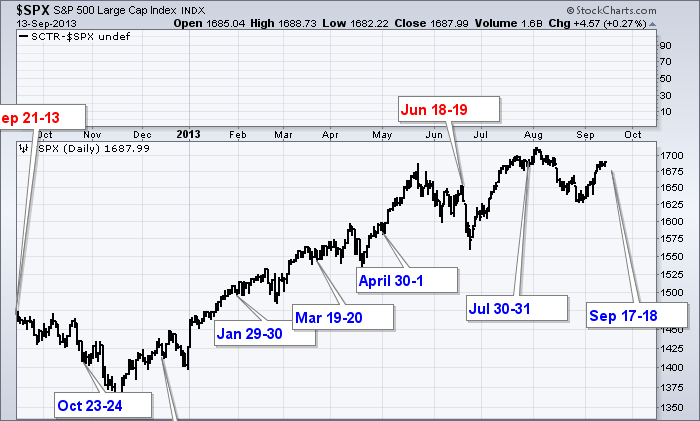
I keep a chart looking at what happened after the Fed meeting dates.
Here is the last year.
You can see if has provided lift at almost every meeting. The September meeting is on the far left edge. It was down from there into the November low. Since the June setback, the $SPX has made higher highs and higher lows. You can see that we haven't made much progress since mid May. For a longer view of the Fed Meeting chart, you can click on this link. Fed Meetings
I coded the July Meeting blue (for positive market move up after the meeting) but other then the first of month push up, August fell top left to bottom right. The other real question mark is the fact that we have stalled at the May highs, which gives us a little discomfort for a head/shoulders top look.
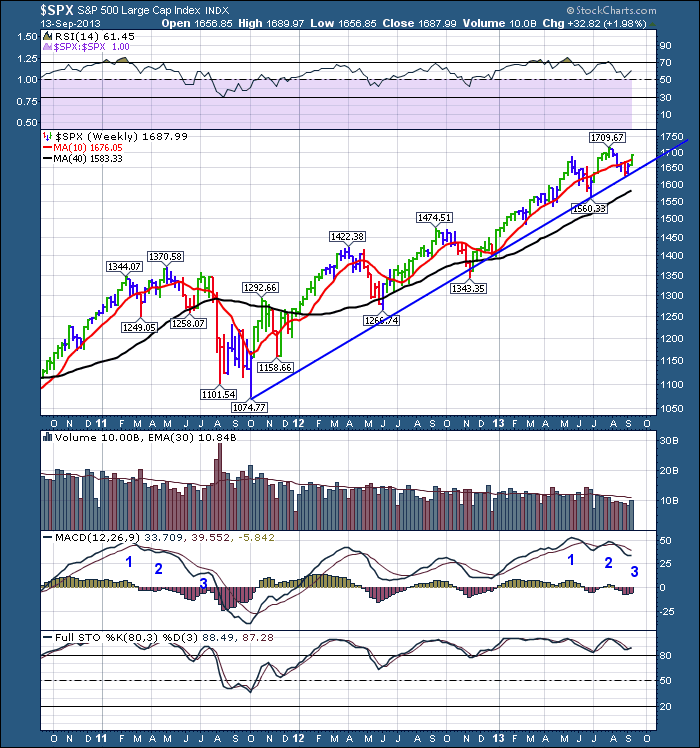
Failing 3 times at the 1675 level is not that bullish ;-( and we can add a trend line of support under the market here which is currently at 1650. So a drop below 1675 would be bearish for a few reasons. We tested 1675 twice in May and failed. The market went sideways after rising above that level in July. It built a floor at 1675 that was marking support for the market. It gapped down and failed to hold 1675. Now after pushing above the 1675 level again, we are just moving sideways for the last week. So we are lacking a little upside impetus at such an important level. I would probably add protection if 1675 doesn't hold, and be very careful if 1650 doesn't hold.
Here is a 3 year view and you can see similar behaviour in the market in 2011.
The reason I drew the trendline at the slope I did was the 4 touches rather than just 2 using the November 2012 low. If I drew on the 2011 to 2012 lows, the support line would be tracking the 40 WMA.
Looking at the MACD it has a similar trend as 2011, but the waves have been stronger where they actually crossed above the signal line. You can also see back in 2011 in the price box, the market had rising lows but the market topped out for the 3rd time at the same elevation as the left shoulder.
One bullish trait is the 80 level on the full sto's continues to hold.
I have been highlighting all summer how jittery the market seems here with the entire globe sitting near upside resistance. It is very important that we push through globally to restart this bull market 'globally', rather than just a US bull market. Eventually the globe has to accelerate if we are going to retain the bull market mode. Almost all of the $SPX, $NDX and $INDU members are global companies.
Good trading,
Greg Schnell, CMT.


