Recently, a number of analysts have been on the investing shows praising the move into European Equities. In full disclosure, a family member works for Royal Dutch Shell.
This stock chart is just so interesting I thought I would put it out there for discussion.
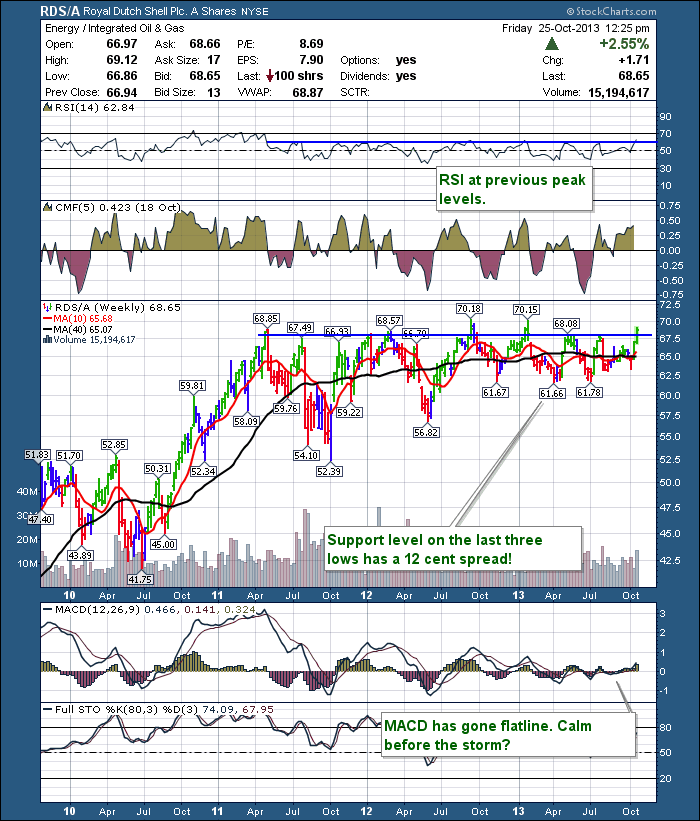
This chart is just so classic for discussing support and resistance, I felt it was a compelling chart to display. Over the last year, Shell has found support within a $0.12 range. If you look closely back in April 2012, you'll see two lows near the same levels at $61.66 and $61.55. When Shell broke down, it gapped down and the stock lost another 8 %. So it was supported 4 times at the $61.60 level, and broke through once. You can also see three lows around that $58 and $59.
On the highs, just study the blue line. This looks like an NHL referee calling offsides as the stock goes over the blue line. There are eight of the labelled peaks and another three including this current push that are not labelled that got turned away or briefly broke above. The stock is barely able to spend more than a week above the line. While the spread between maximum top price is a little wider than the base support I pointed out, this is a compelling example on a company with around 6 billion shares in the float. It is a little tricky as they have London A and B shares, Amsterdam Shares and US Shares A and B shares.
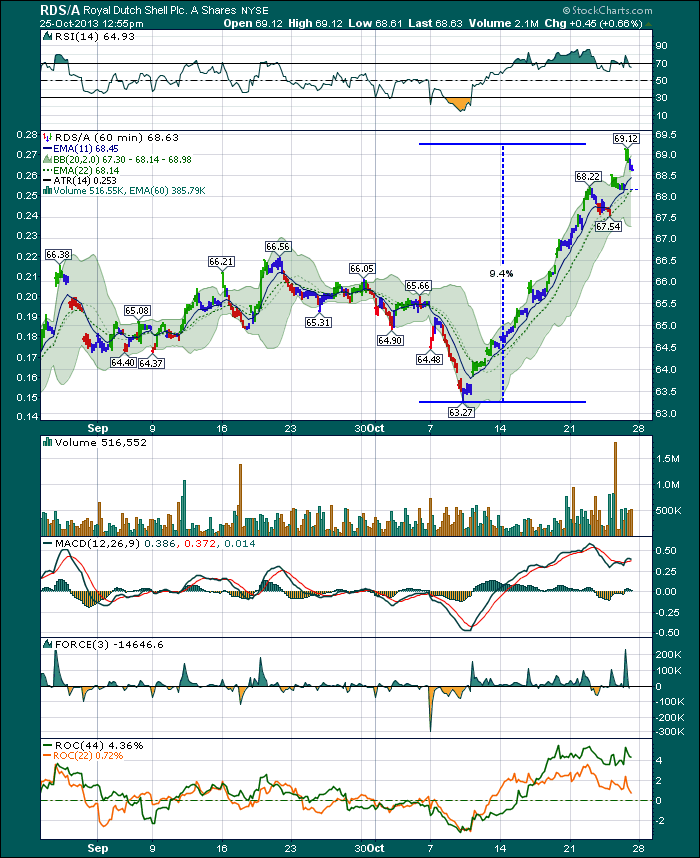
Look at the view of the 60 minute recently. This looks more like Facebook than a 100 year old company!
We'll see if it can finally break out of the weekly zone. Currently the move up to resistance looks complete again as the MACD puts in a lower high while price puts in a higher high.
As Shell is not in the SP500, there is no SCTR rank for Shell.
Understanding support and resistance levels demonstrates how weekly charts are valuable to a person trading on 60 minute charts. If Shell can finally break out and get above the $70.25 level (Previous high + a little bit), it would be a better place to look for an entry than the current price high of $69.12 which has huge resistance between here and $70.25. Then if Shell can push through these levels, there is very little resistance to the price moving up as everyone who bought in the last 5 years would be in a positive position. Shell has a healthy dividend so lots of people like to hold it for that.
Good trading,
Greg Schnell, CMT


