Yahoo! What a 4th quarter touchdown!
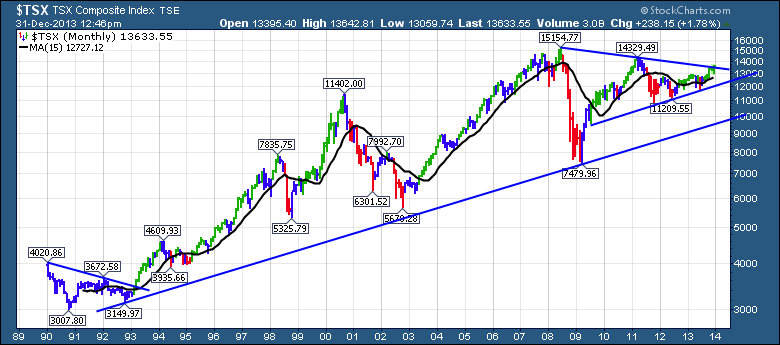
Let's start with the 25 year view.
From the sideways markets of the late 80's, the first three years of the 90's.
The 1980's (not shown) had the $TSX stall at resistance at the 3000 level in 1980,1981. It spent the next 12 years moving above it and pulling back to the 3000 level. It finally got lift off in early 1993 that broke a multi year trend line. The next 5 years had the $TSX move from 3500 at the breakout in 1993, to 7835 in the spring of 1998. Then a tough year ensued which saw the $TSX lose 32% before yearend. The next rally was one to behold. 5325 to 11402 in 18 months. Better than 100% if you sold your Nortel on the right date. The Nortel stock made up more than 30% of the $TSX at the time, and quickly plummeted into bankruptcy. The pullback reversed 90% of the gains off the lows of 1998. After a multi year decline, the $TSX got back on its horse in 2003 and rode above the 15 month moving average. I picked the 15 month which is roughly the 65 week moving average loved by Martin Pring. However, I picked it because it is a best fit line for support of the major uptrends. Maybe that is why Martin likes it too!
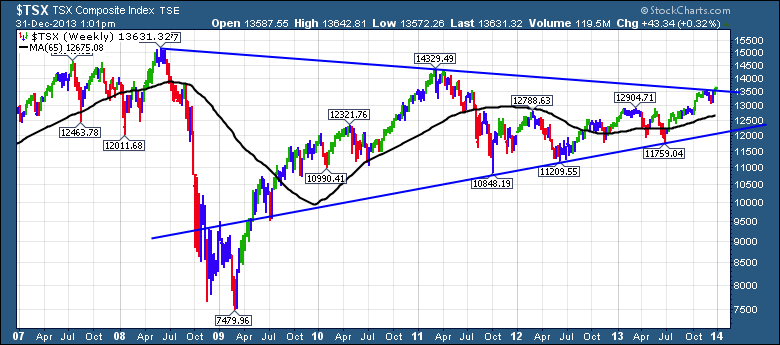
The cross above the 15 MMA also broke the down trend line from the 2000 top. It was another ride to behold. The $TSX never had a red Elder month until December 2007!!! In this case, it was almost a triple off the 2002 lows. Then the market lost 50% of the gains and we dropped to 7479 on the final lows. Since 2010 we have oscillated around the 12000 level. In October 2013, we broke above 13000 decisively and actually got the 15 MMA with a positive slope up to close out the year. But something meaningful happened this week. Lets zoom in on the final 7 years.
This is still a little hard to see as the weekly bars are smudged together, but we can see a clear pennant pattern here. Within the pennant, a lot of work on building a wide base for the last 2.5 years. This week, we pushed above the 2007 - 2011-2013 trendline. I have converted the monthly moving average to the 65 week moving average. Before we leave this chart, notice how the 2011 top looked. We built a small topping structure over 2 or 3 months and then let go. We kept testing the level multiple times and then started making lower weekly lows and lower weekly highs. Eventually this traced out a significant top.
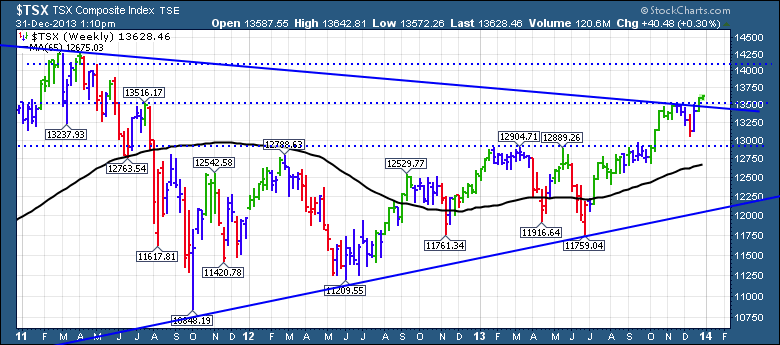
Lets zoom in some more now. Here is a 3 year weekly view with a 65 WMA.
The index had pressed above the trendline last week. The real important step is that it not only held above but it continued moving higher this week above the downward sloping trendline. We can also see a fine horizontal dotted line. This marked a resistance area on the left side of the chart that was significant. It marked the highs to the left and right of the final top. So are we in the clear? Well, this is a pretty strong signal that the world is willing to pay more than any time in the last 2 years as well as making a higher low above the former resistance level and now a higher high. Can we push up to the 2011 highs? I would suggest that this is a pretty strong chart pattern and an equal move would put us up at the top dotted line around 14100 or another 500 points from here.
Here was my blog as the $TSX broke through the 12925 resistance level. Bullish. It was also interesting to go back and click on the charts from that date. Lots of the European charts have had really tough patterns for trading since the end of September. Wild swings for a couple of weeks at a time. See London, France and even down under Australia. I wrote a blog mid December about the umbrella tops on the commodity currencies. Canada's loonie continues to lag, lose altitude, make lower lows and multi year lows.
What could go wrong? If the market pulled back to the 13000 level and then rallied one more time, anything less than a new high would build another head and shoulders topping pattern. But for now, we are making higher highs and higher lows.
I'll be writing the market message tomorrow with some interesting timing charts for the $SPX. A while back I wrote a blog about the Fibonacci ranges pointing to an $SPX at 1960. It feels like the market has enough momentum to continue up there. That is another 6 % above the current market. The $NYAD continues to confirm the higher highs. A pullback to the 200 DMA in the $SPX is 8%. That would be the largest pullback since QE III set sail.
The USA market looks ok. The majority of world markets are above the 20 month MA which is bullish. The Shanghai continues to lag. Many global markets are at multi year resistance levels, including the $NASDAQ percolating near the 2000 highs. The issues to derail this rally might come from China, Japan or Europe.
I did mention the $NIKK in early December. I suggested it needed to have a big month. And it did!
The Aussie market is back above the 50 DMA. The London market is as well. One thing that concerns me in those markets is the RSI made it down to 30 and is now testing 60. If they were going to roll over and fail, this would be the time.
For now, we can party like its 1993 or 2003 or 2013! Hopefully with a similar result in the next year! The following Spring in both years(1994,2004), the market continued higher till March.
Even better, hopefully like its 1992 or 2002. In both cases, the $TSX broke out of bases and went on a solid one year run!
Happy New Year !
Good trading,
Greg Schnell, CMT


