The $TSX is a great example of demonstrating both short term and long term resistance.
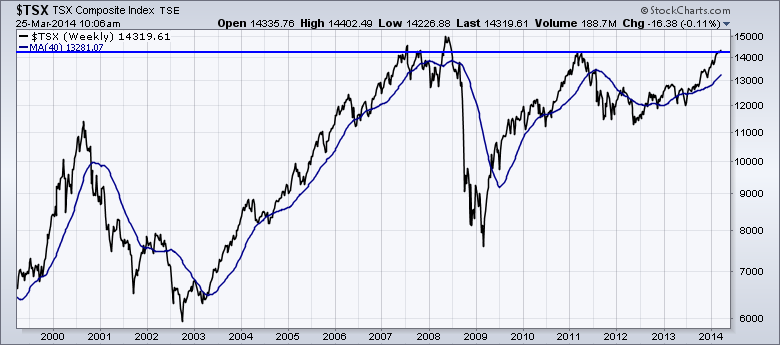
First here is the long chart.
When the $SPX made highs in July 2007, the $TSX made a spike above this blue line. When the $SPX made a higher high in October 2007, the $TSX intra week made a higher high, but did not according to this weekly line chart. It closed the week at a lower level. Then oil went on the surge to infinity and topped out the $TSX on June 5, 2008. The $TSX built a nice 2 month head/shoulders topping pattern in 2008. The $TSX made a double top in 2007, 3 months apart. 14625 in July, 14630 in October.
Why is this all relevant? Not unlike the ceiling in 2012 where the market could not make new highs, long term charts exhibit that same trait. Whether we push through here or not, we should expect some choppy water that will wear out both the bulls and the bears. We can see this area has been resistance before. so it is appropriate to tighten stops. In 2011 our high was 11329. Now we have spent three weeks trying to get above that level.
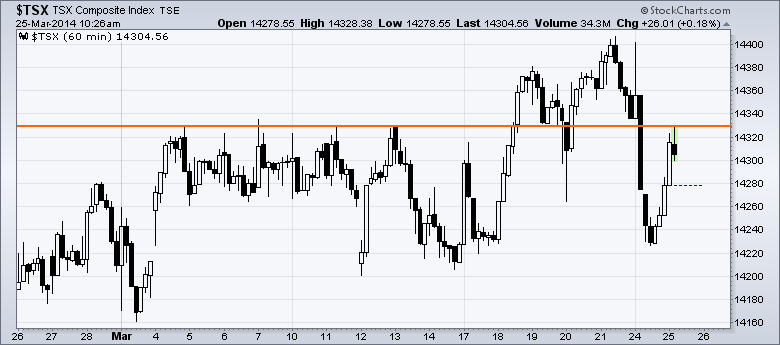
Look what happened so far intraday today.
It is an important line on the charts. We will be faced with lots of resistance between here and 14630. I didn't conveniently place the line so todays candle stopped there. I entered 14329 as a horizontal line in the overlays. Click on the chart above to see the chart settings.
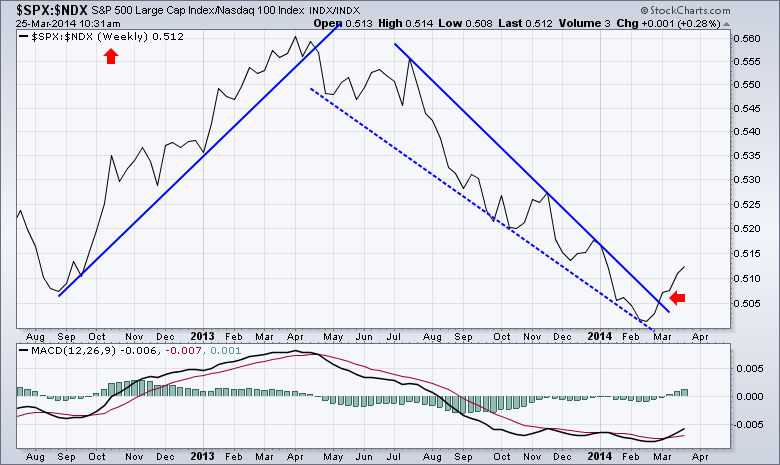
I am concerned as the market appears to be rolling out of growth stocks and into safety stocks like Walmart. The Nasdaq has started to underperform the $SPX which is a big signal of a trend change.
This ultimately means value vs. growth. It may not mean sell, but it definitely means rotate. Some of the higher fliers like TSLA are already down 20 % off their highs. When you chart flip through TSLA, PCLN, GOOG, TWTR, FB, etc. you can see a clear move away from this growth stock arena.
There are lots of other clues showing up. TLT: $SPX is starting to turn higher. This means the safety of bonds is outperforming the $SPX.
Even GMCR has had very little momentum after their sudden surge on Coca Cola partnering. It looks ready to cliff dive. I think it is very important to manage profits here.
We'll see if we are still fighting to break through 14329 on 14.03.29! Its a Saturday!
Good trading,
Greg Schnell, CMT


