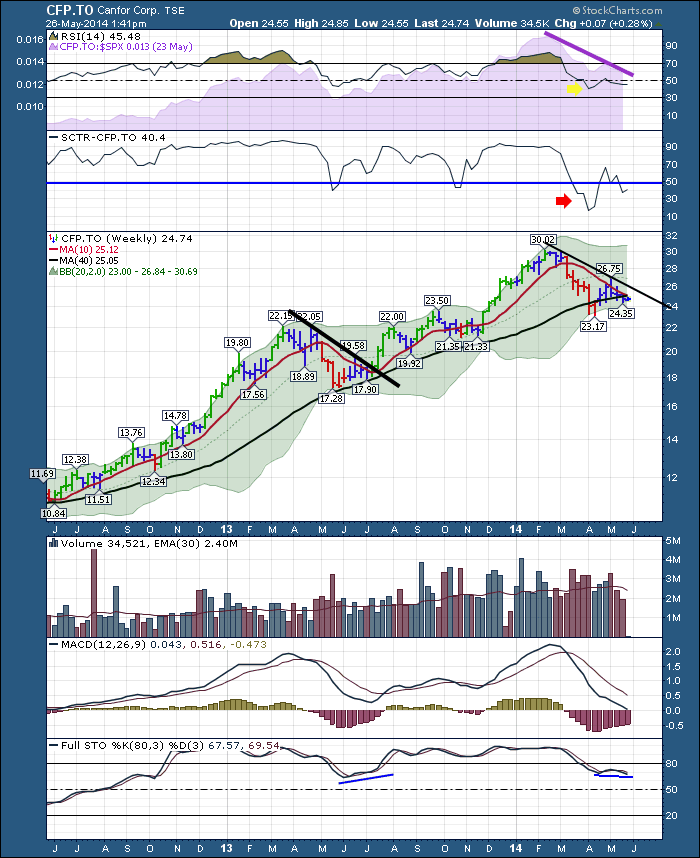
Canfor (CFP.TO) has been in a long up trend. It has been a beautiful ride. Today Canfor looks like it is at a major support line. There is some indication that the investor support is waning.
The RSI has put in the lowest low in 2 years on the chart marked by the yellow arrow. It bounces at the 40 level which is considered the lowest level for a bull market trend so that is still ok. The SPURS in purple are in the longest decline in two years so that is concerning. What concerns me even more is the SCTR. For the last 2 years it was in the top 50% of the stocks. It is now living in the bottom half of the stocks on a technical strength basis. It is clearly a weaker reading. The price action is in a down trend and is trying to hold above the 40 Week moving average (40 WMA).
The price is near the lower edge of the standard setting on the Bollinger Bands. Volume is declining here over the last two weeks where we would like to see the volume pick up as it bounces off a key level. Bearish development. The MACD is testing the zero line. We would expect it to find some support soon but it is at the lowest level in 2 years. The long setting on the Full Stochastics is also having trouble staying above the 80 level.
In summary, the indicators look weaker than they have been. The fact that institutions are not hitting the buy buy buy button at the 40 WMA is concerning. $LUMBER closed at major lows last week as well. Canfor was weak until early July 2013 and then it accelerated. A break above the 2014 black trend line on price would be a good signal to go long. If this 40 WMA does not hold it might be better to keep the powder dry for another opportunity.
Good trading,
Greg Schnell, CMT


