In the last article (I would encourage you to read 1-8 so this article makes sense) we started to run scans.
In this article, we want to set specific tracking alerts by email and text. We also want to get some quick ways to follow solar through the day for people who can't follow the markets full time.
First, let's learn how to set alerts. Using the same view as we looked at in last week's solar article, you can see the two red arrows on the left pointing to the 'Technical Alerts Workbench' on the Members tab.
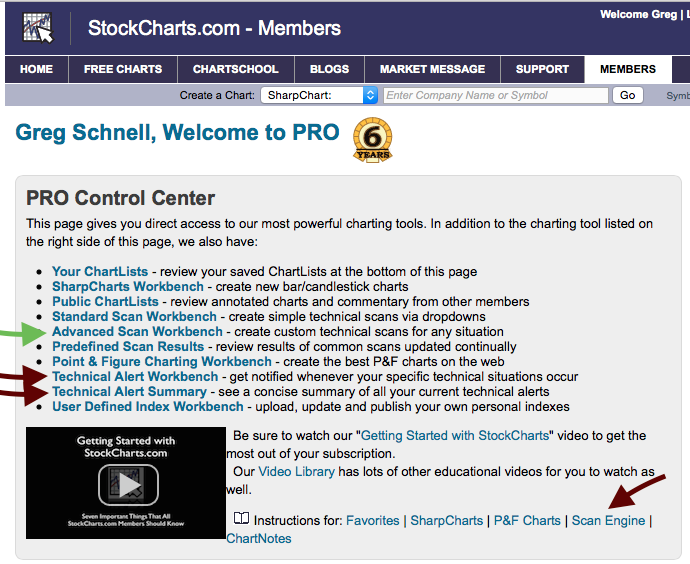
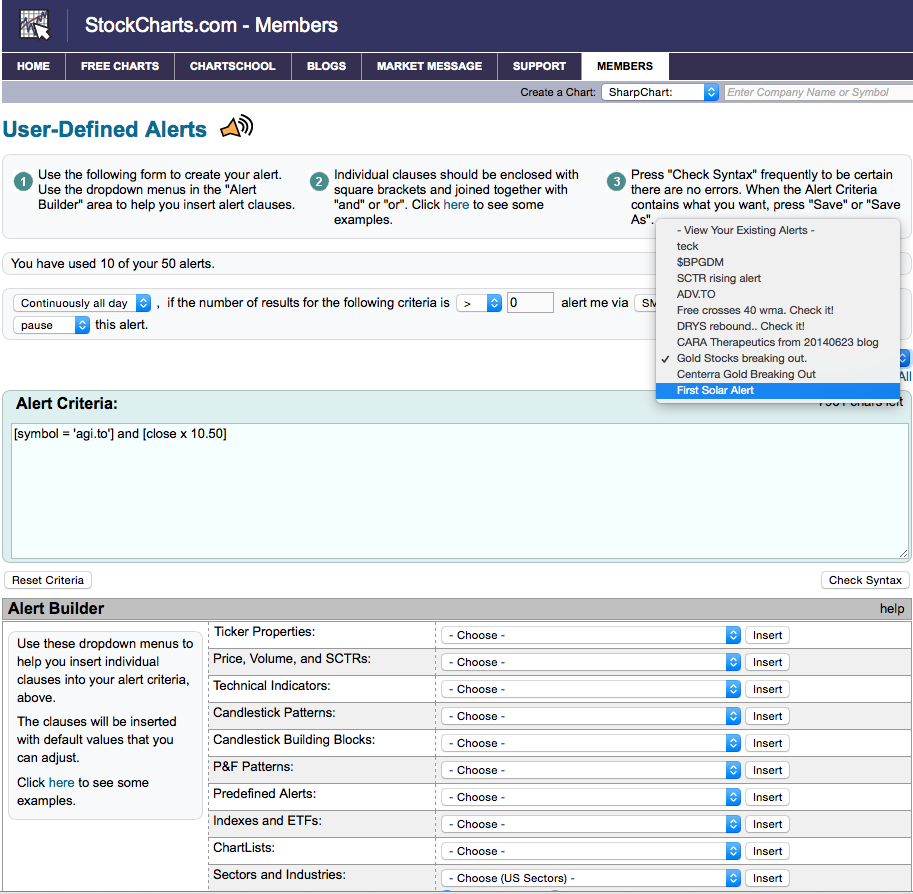
We are going to go in and set a technical alert. Lets click on the Technical Alert Workbench link. It should open to a page that looks very similar to the scan engine.
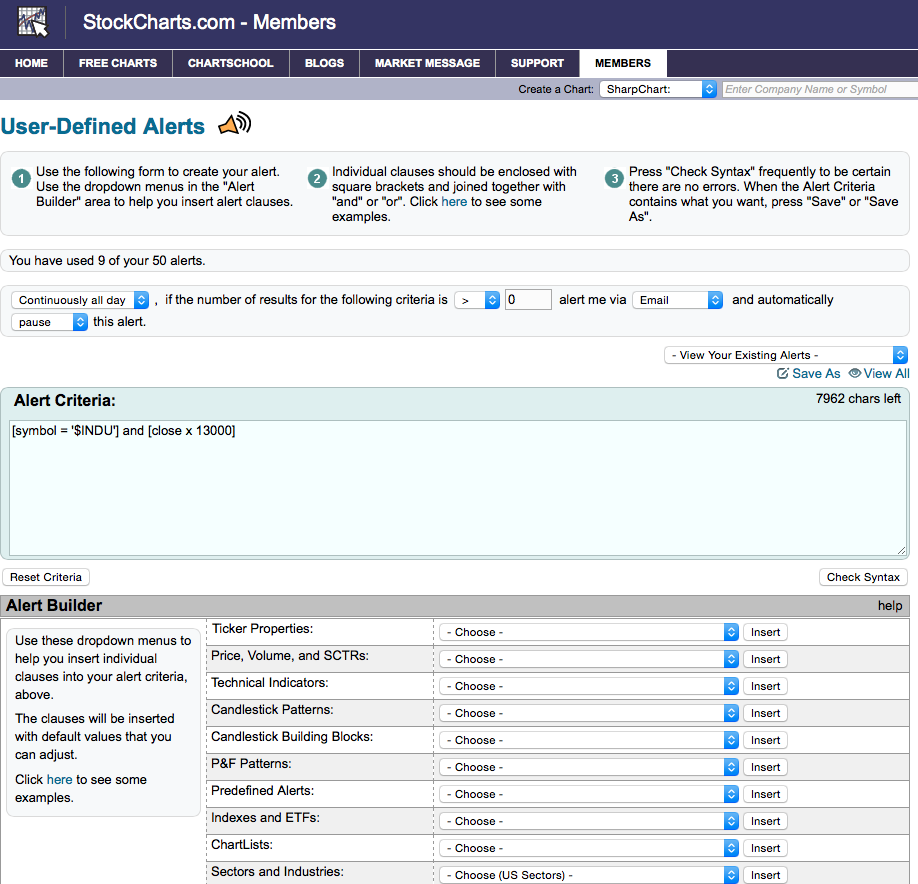
So this is real simple to use. Up at the very top, the three steps are shown to describe how to use it. The second area is important for how you are notified. You have the choice for email or sms or workbench. Workbench literally means it will pop up on your StockCharts tab during the day. Text (SMS) works in Canada and the USA for sure. The email is obvious. The phone number and the email address are in the' Your Account' link on the very top right - the very top right - of your screen. Make sure they are set to places that you want the alerts to go to. The next drop down is for delete, pause or continuous alerts. Feel free to work with this, but the right answer is pause for me. Send it once and don't delete the alert.
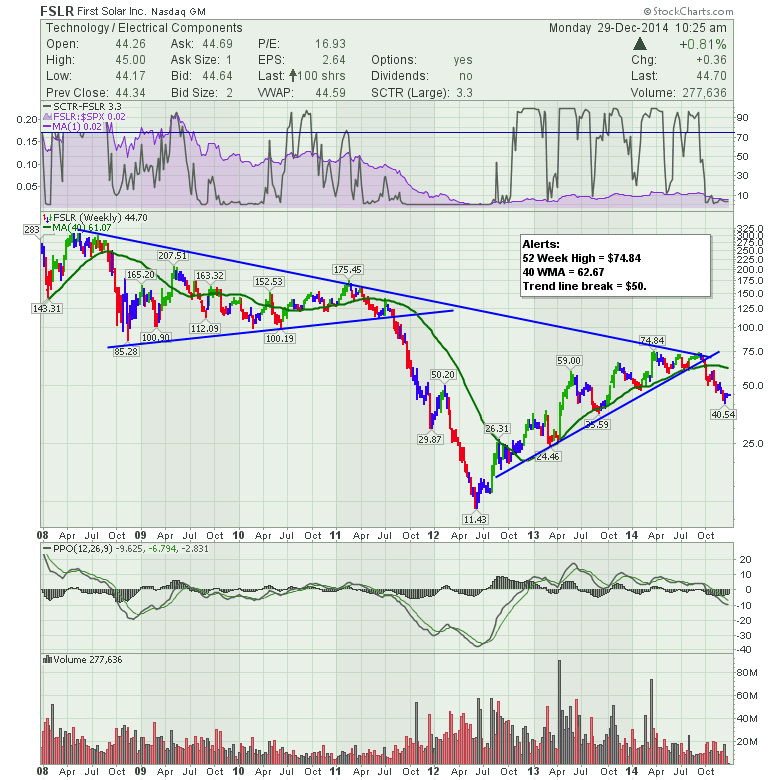
Now the alert criteria could not be simpler. In the case where we are trying to monitor for trend line breaks rather than moving average crossovers or some indicator level, so this is where you can customize a level for each individual stock. On our weekly charts in the Solar Scanning List 2015 chartlist, you may remember we had an annotation for a trend line cross. Here is First Solar (FSLR) as an example. I had written in 'trend line break at $50' a few weeks ago. That may be lower now, but we'll stick with the original $50 so everyone can follow along.
How do we write that into our Technical Alert? Just put the ticker symbol (with apostrophes both sides of the ticker symbol as shown) and the price point you want it to cross. Click on the Check syntax to make sure it is right.
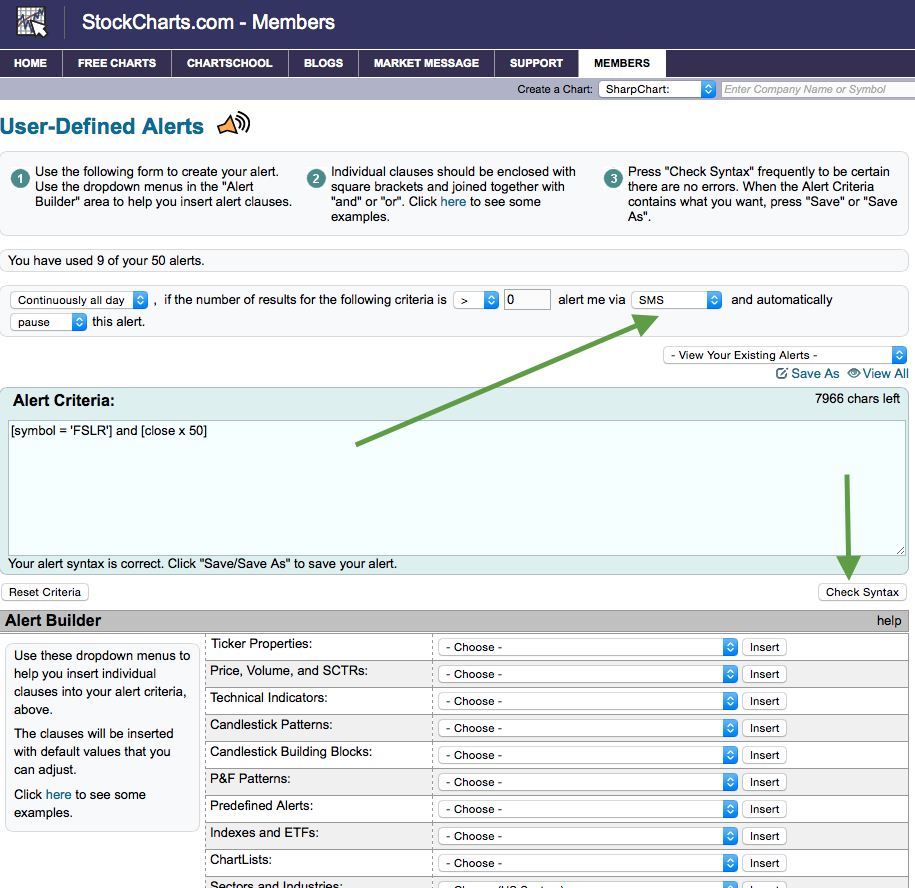
To finish you must save it with a name that you can pick out from a list so this might be First Solar Alert as an example. So here is an example of the drop down list for saved alerts. You might want something more informative. As an example, I named one of my previous alerts as ' SCTR rising alert'. That is not much help now a few months later until I open it and study it. The one I listed for Cara Therapeutics was for a blog on June 23rd. That is more helpful. You get the idea. Make the name meaningful.
So we are done with creating Technical Alerts. Was that super easy? From the Members tab you can also go to the Technical Alert Summary. That needs no explanation and you can go there to test it out. I would encourage you to set up an alert for where you might like to be reminded of a solar stock to meet your entry criteria. As an example, would you still use $50 for FSLR? If you picked a new level, say $47.21 for the trend line break, then you would just edit your alert perhaps once a day, once a week, once a month depending on your entry style. Remember the 'x' between FSLR and 50 means crossing above. So if you wanted to find shorting opportunities, you may wish to look at stocks falling below a level. An example might be [symbol = 'SPY'] and [206 x close]. By reversing the two components this now means that 206 crosses above SPY close or in layman terms, SPY fell below 206. So that is how you control the direction of your alert. If you trade the market both directions, then in saving your alerts, you're going to want to use alert names that are indicating a short position or a long position when it comes by text, email or flashes up on your screen. Try setting a very close alert both directions and change how you get the information for three different tickers. If all the high flying stocks you monitor are starting to give short alerts, maybe that is a clue to upcoming broader market weakness.
Let's talk about monitoring intraday and at the end of the week. There is a new feature that you might be interested in. Check this out. When you are looking at the stocks in Summary view, you can see the '5 second refresh' option shown at the top. For very short term traders, this might be your setting. How did we get to this page? From the Members tab, scroll down to your chartlists. Select Summary beside Solar Scanning List 2015. Then select from the dropdown box on the right.
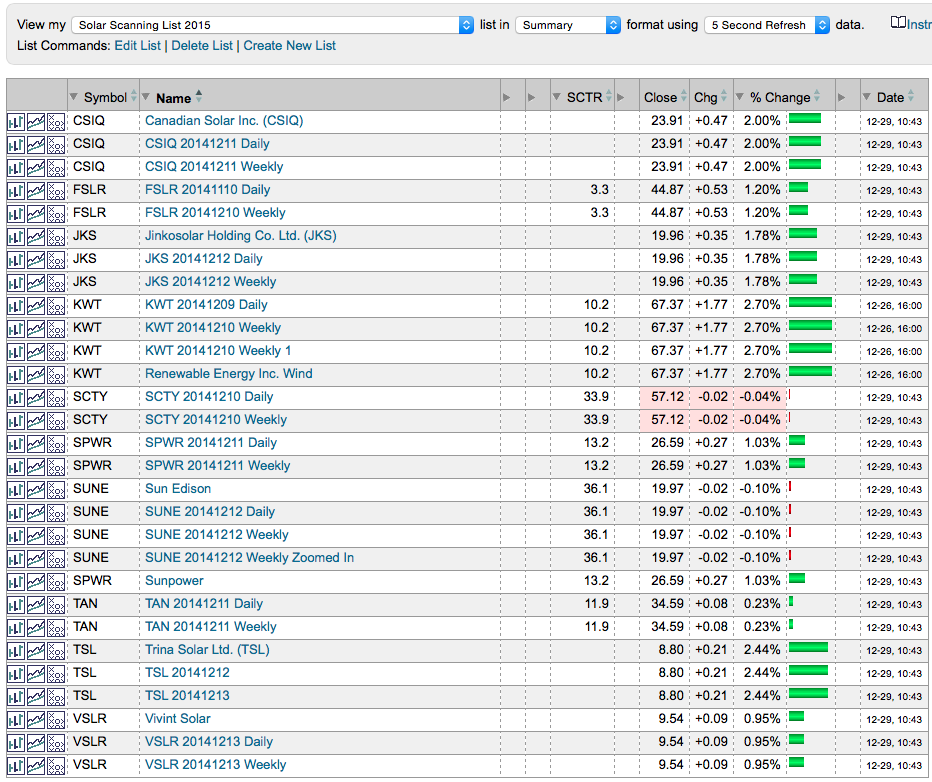
I like the intraday view to see how the broader solar community is trading throughout the day. I can refresh it when I want.
You can also use the ChartBook view and the 10 Per Page view to visually scan the charts in a rapid fashion. Visual investors like myself love the 10 Per Page on an iPad to scroll through long ChartLists. The CandleGlance view is excellent for a quick look but it changes every ticker symbol to the same chart setting. The Gallery view is helpful for really analyzing a stock.
So this is the final installment for the Solar Scanning List 2015 series. Hopefully I have helped you develop an attack plan for an industry group. You could also do this entire process putting one chart for each of the industry groups within each of the nine sectors. You could do this with dividend paying stocks. You could do this with teen retail, Oil and Gas, Uranium, regional banks, natural gas stocks, semiconductors, casino operators, hotels, airlines, coal. You could be monitoring stocks that cross above the 75 level on the SCTR and keep those in a working list. All of these are groups that you could compile into a specific ChartList to track. You can track multiple ChartLists but this helps you stay abreast of industries starting to move. Through the Solar ChartList exercise, I labelled the ChartList 2015 indicating that this was not immediate, but it was getting set up for the turn whenever it comes. Technical trading is like that. Setting up a plan to trade an industry group, setting alerts to let you know when things are changing and being ready to identify the early movers in the group. If that helps you set up some great trades, then it will be worth the time and effort spent. If you enjoyed working through this exercise, feel free to send me a note. This is a great time of year to set up what should be the big performers for next year. The harder we work at planning, the more good luck we seem to have.
Good trading,
Greg Schnell, CMT
PS. All of the articles for this series were written in December 2014. You can always refer back to that month in 'The Canadian Technician' archives to review how to set this up for other industry groups. Click on December 2014 archives, and then enter Solar in the Search box. If you can't remember the month, just enter Solar in the search box once you are at The Canadian Technician blog page.


