This is the final chapter in the solar ChartList setup. After than we'll continue with scans/alerts to help us. We have two stocks left to cover off. Trina Solar and Vivint.
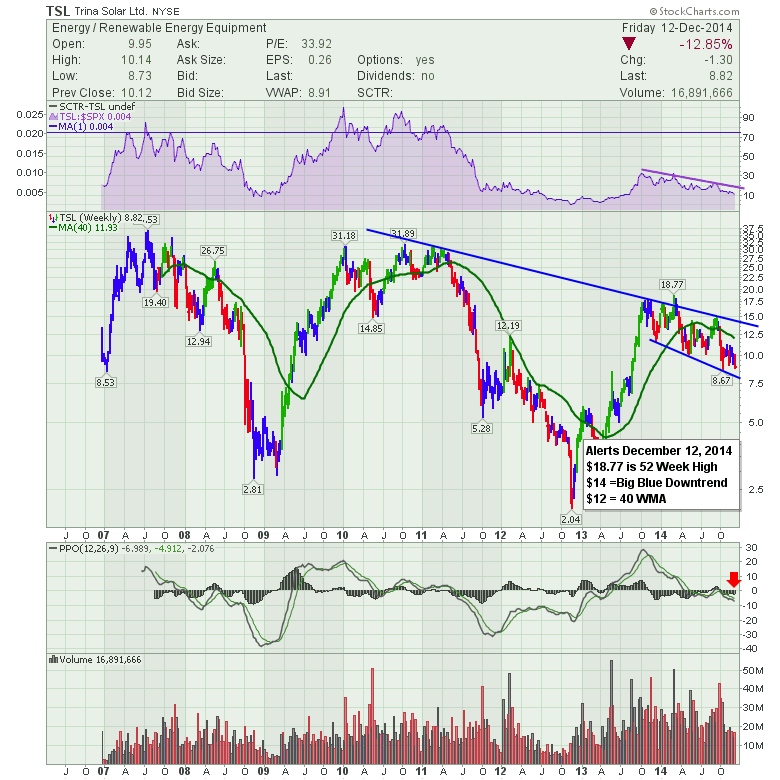
Here is Trina Solar (TSL). This stock has a long-term history of being a roller coaster in my view. It has had huge swings either way. As an example it dropped 12.85% this week and that does not look abnormal on the chart.
1) The SPURS continue to drift down. The stock is underperforming the $SPX. No trend line break there.
2) There is no SCTR for this stock.
3) The price action is excellent for swing traders, painful for buy and hold. After making a push in February to $18.77, Trina is down 53% to $8.82. Most of that occurred since September.
4) The PPO is tucked below zero, making marginally lower lows and pointed downward.
5) The volume is excellent with a 20 Million/week average. But the volume chart has two standout traits. Notice in 2009 how the volume absolutely dried up? And it did so for months. If you remember the 2009 lows, the mood of pessimism was everywhere. The market topped in January and fell to the March 9th low. Notice how this stock volume plummeted through this period. The price action followed the trend of the market lower but it was a fabulous clue. Look at the fall of 2011 and the summer of 2012. Well, the volume in the last 4 weeks has been quieter than all of 2014. Interesting stuff.
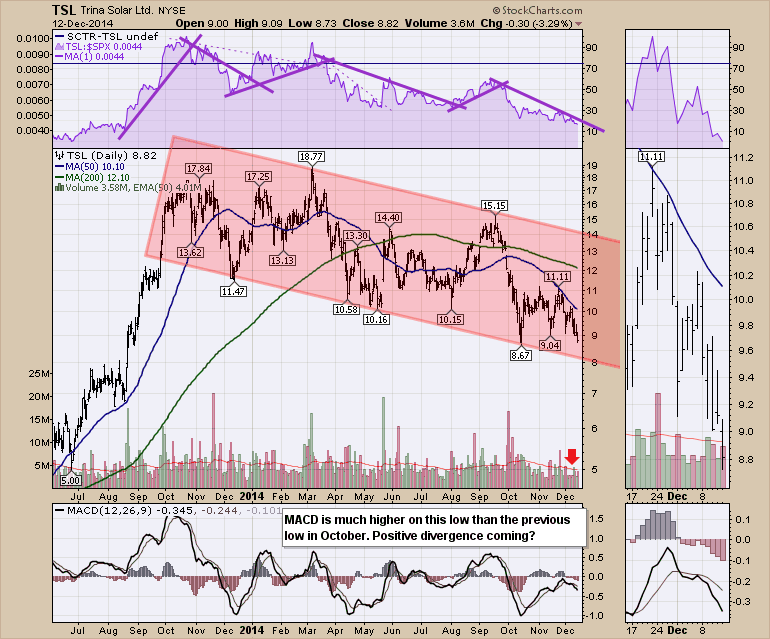
On to the daily for Trina Solar.
I have drawn some trend lines on the SPURS. You can see the signalling has been pretty good. However, there have been some whipsaws as well. The breakout on March 1 noted by a thin dotted line would have had me bullish. However, the stock quickly reversed from the 52 week high which would be a failed breakout. Those are some of the best signals. There is another surge above the dotted line in mid May. It too was a short-lived break. The stock spent one or 2 days above the 200 DMA and rolled over. The price action is down and to the right. The volume is quite low. It has pulled the moving average down to 4 Million a day. Just something to watch. Lastly, the MACD seems to have an oversold level of -1.0. The $8.62 low is just below. If that breaks I would expect another leg down.
The pattern on many of these charts is so similar. However, the magnitude of the moves are very different. This stock was up 50% from August 1, 2014 to the September top. In 30 trading days a 50% gain! Then it fell 40% in a month! If the overall $SPX is pulling back, I would expect this to continue pulling back.
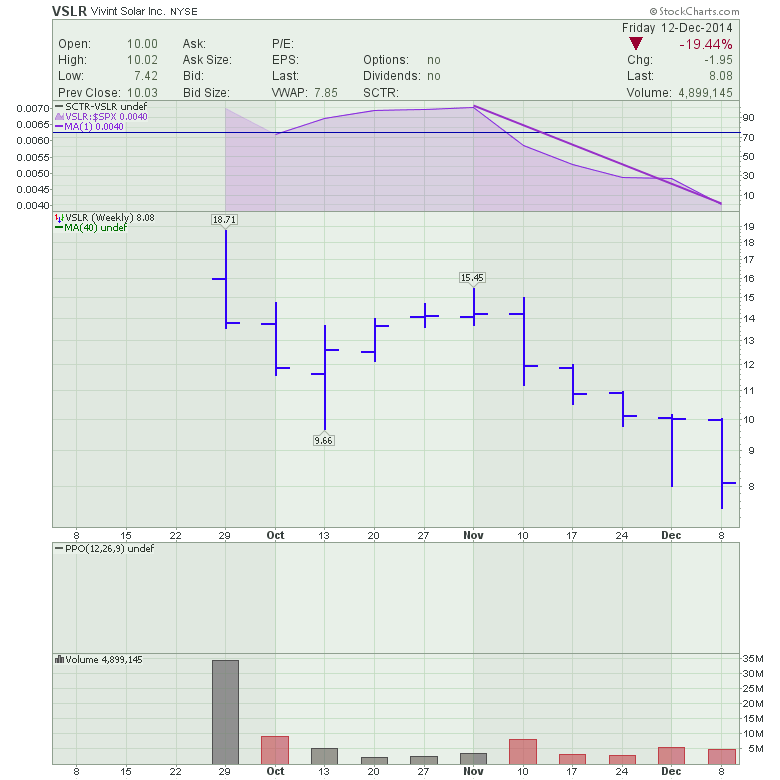
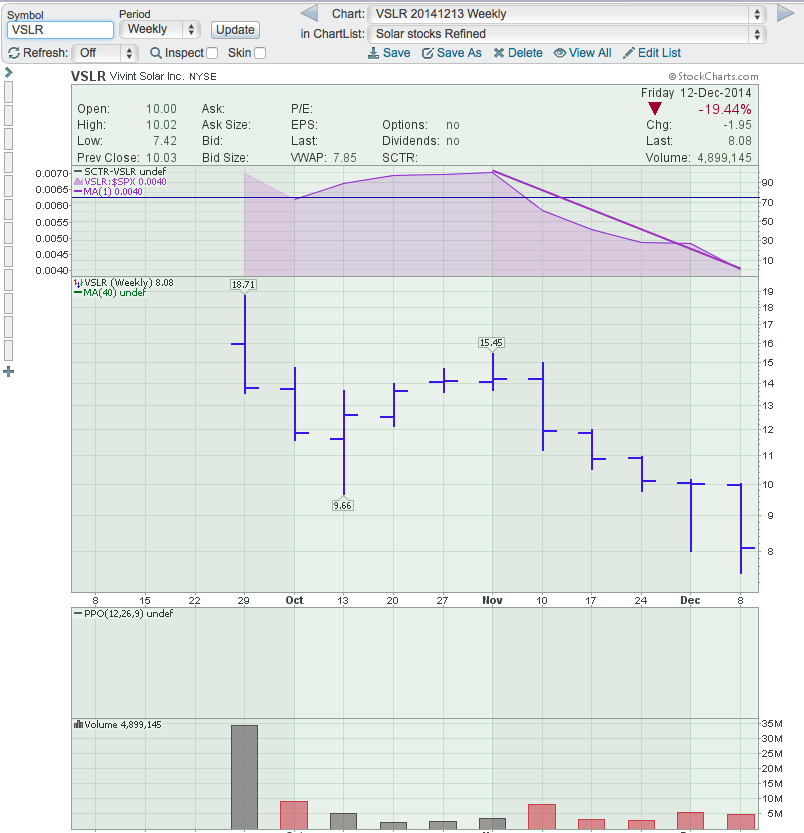
OK. Next on the agenda is the final stock, Vivint Solar. (VSLR). This is a new IPO after the $SPX marked its September high. So the timing of the IPO had this stock sell off almost immediately with the rest of the market. It has continued lower with the industry selloff that is a downdraft in energy stocks. This week (December 8th) it lost another 19% after last week's plunge and reversal to close flat on the week. OUCH! The stock is down about 50% from the IPO. Apparently they are the second largest residential solar installer in California. You'd think the sun forgot to come up the way this is getting smoked. But as you can tell, the industry is trading down and even the best get sold in a downward period for the industry group. I have no levels on this chart because it is so new there is no 40 WMA and the 52 WMA is from IPO week.
1) SPURS are declining.
2) No SCTR.
3) Price - Down.
4) No PPO because it is so new. It needs 26 weeks for the first data point.
5) Volume is respectable with 3-5 million a week.
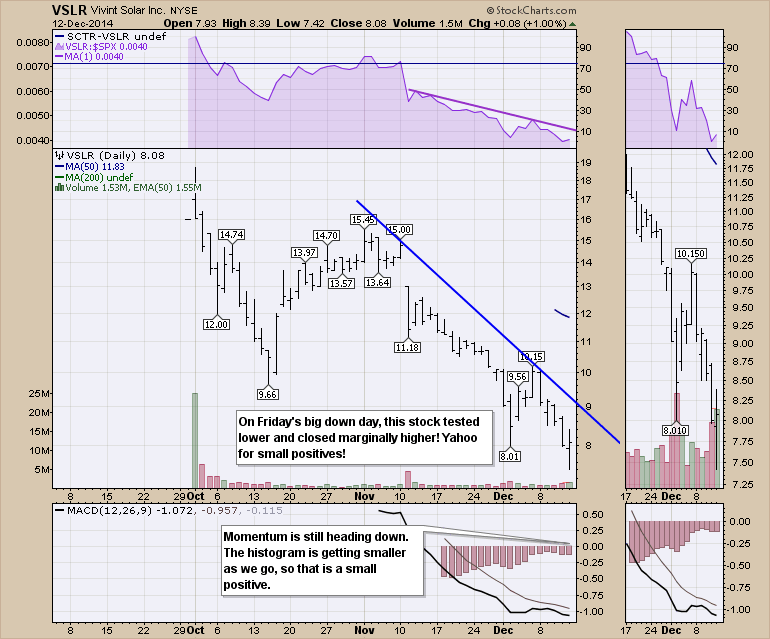
On to the daily. Well no surprise here. Everything is pointed down. You can see the 50 DMA is just starting around $12. We are 50% below the 50 DMA!!! Yikes!
So that wraps up our stocks. We have a nice ChartList. I have saved individual copies of both the weekly and the daily. In some case I wrote over the original chart, in some cases I created a third. So my list might be more messy than yours! However, as we work through this list, we can clean it up. I could go into edit mode and just wipe out all the extras. I cleaned out MSFT. I cleaned up some of the names. I will have a few additional charts like SUNE zoomed in as an example. No big deal. We have a really scrumptious working list for Solar stocks. But my original title is really boring. Oddly capitalized etc. I'll show you how to change that.
So from the top of any chart, you can go to edit list. Here is the top of Vivint Solar. You would click on 'Edit List' in the grey box above Friday 12-Dec-2014.
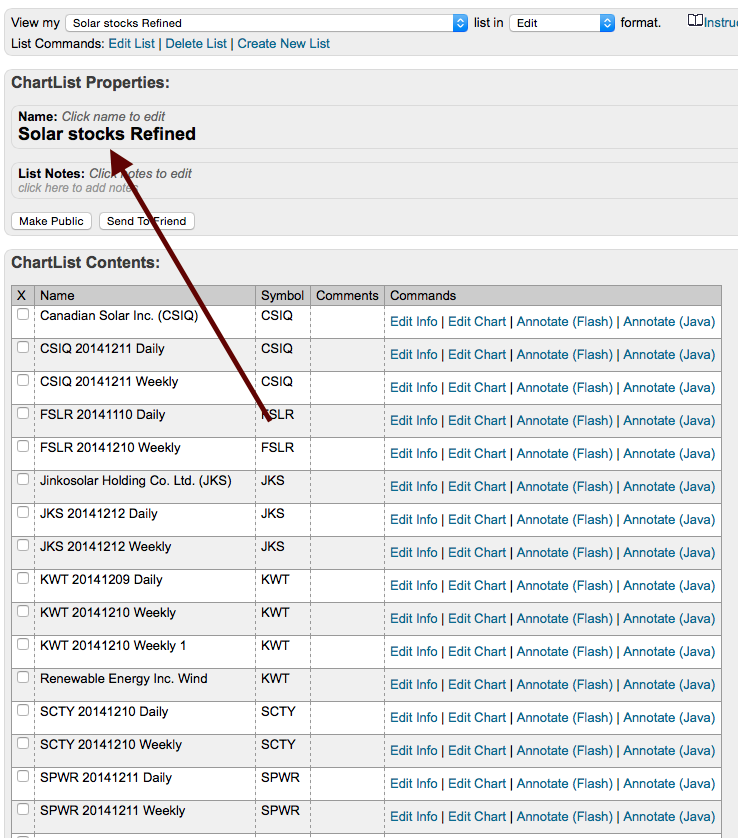
That brings you into the edit view. You just click to rename the title.
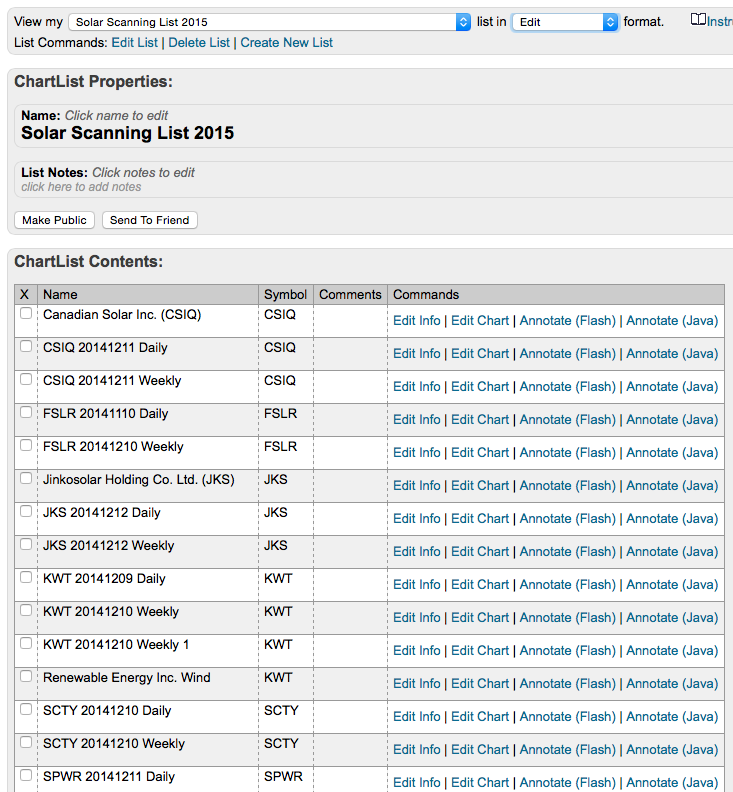
Let's pick something more timely. Solar is probably the word we'll think of when we are browsing through our ChartList so that is important. We are going to set up some scans to run against this. So we could put 'Solar Scanning List 2015' as the title. Whatever you call it, you'll need to use the name in all of the scans we are going to set up. So if you pick a different name, just remember to use that name in all your scanning. Some people organize with numbers in front which is a great idea. For the purpose of this exercise I won't.
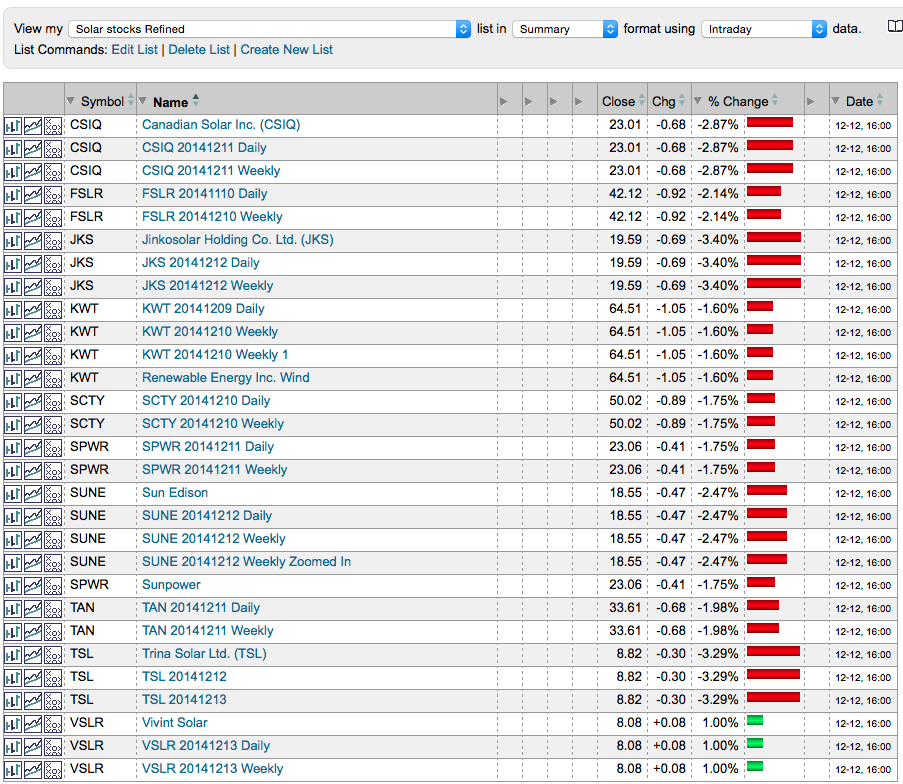
OK. A clean tidy package to review. How can you look at this list quickly?
Use the drop down list at the top to look in different views.
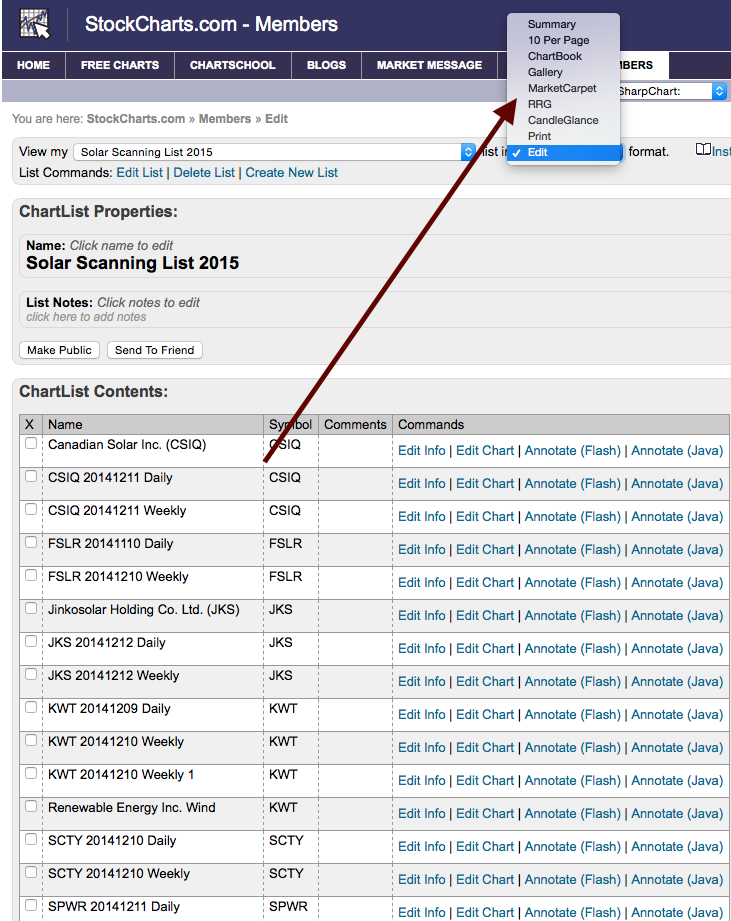
Next we'll look into the various chart views and then we will build some scan ideas for this group. Super simple scans that help us find strong stocks.
I'll leave you with another video from September 2014.
Enjoy your week!
Good trading,
Greg Schnell, CMT

