The gold miners had a big day yesterday, but the mining sector has been moving across more than just gold.
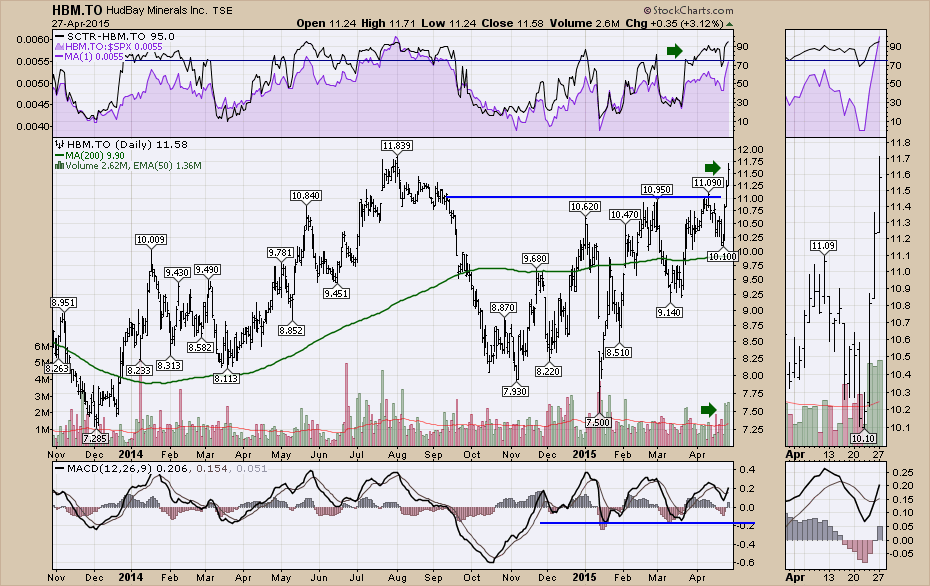
Here is the chart for Hudbay Minerals (HBM.TO). They are involved in zinc and copper with some gold and silver. This is a nine month breakout and is threatening the 52 week highs.
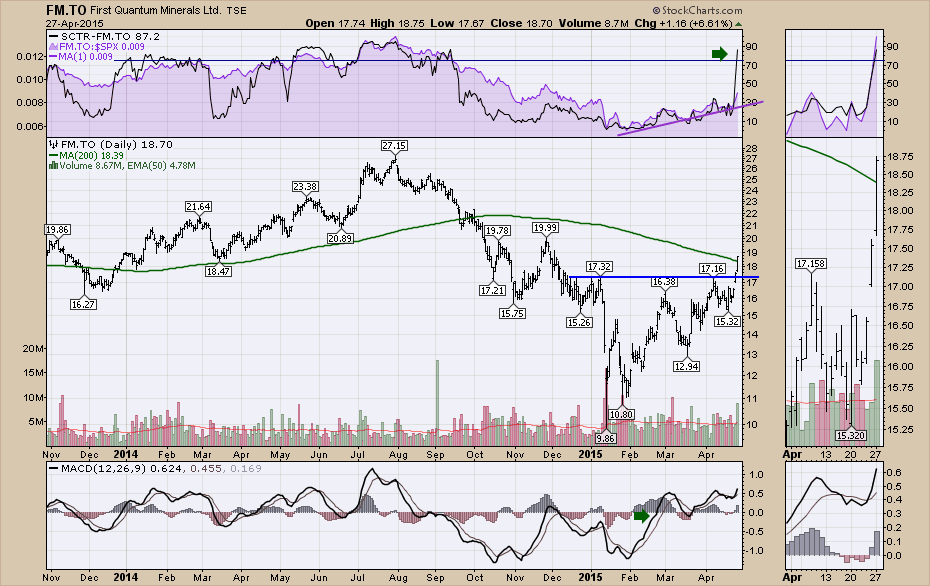
Here is First Quantum Minerals (FM.TO).
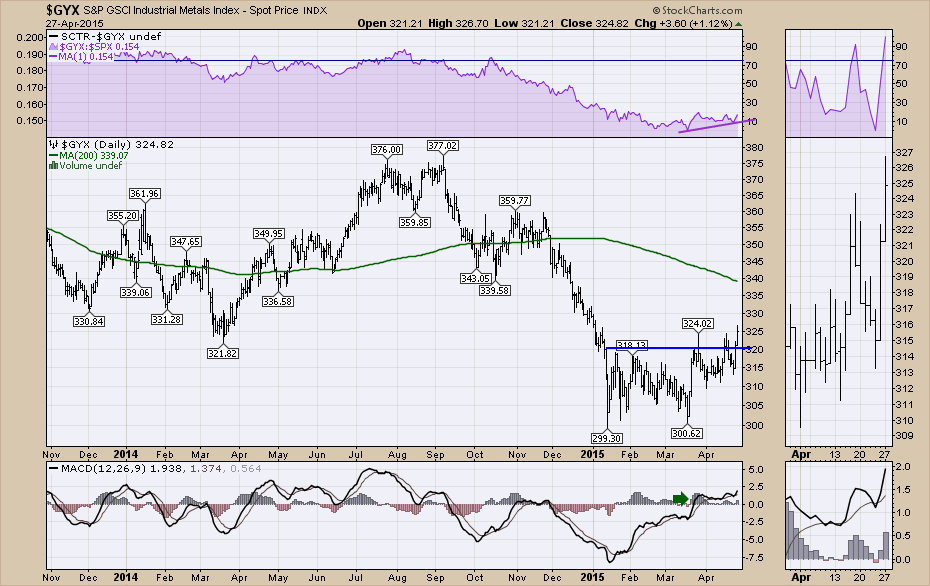
However, the Goldman Sachs Commodity Indexes (GSCI) are also telling us the story. This one is for industrial metals ($GYX).
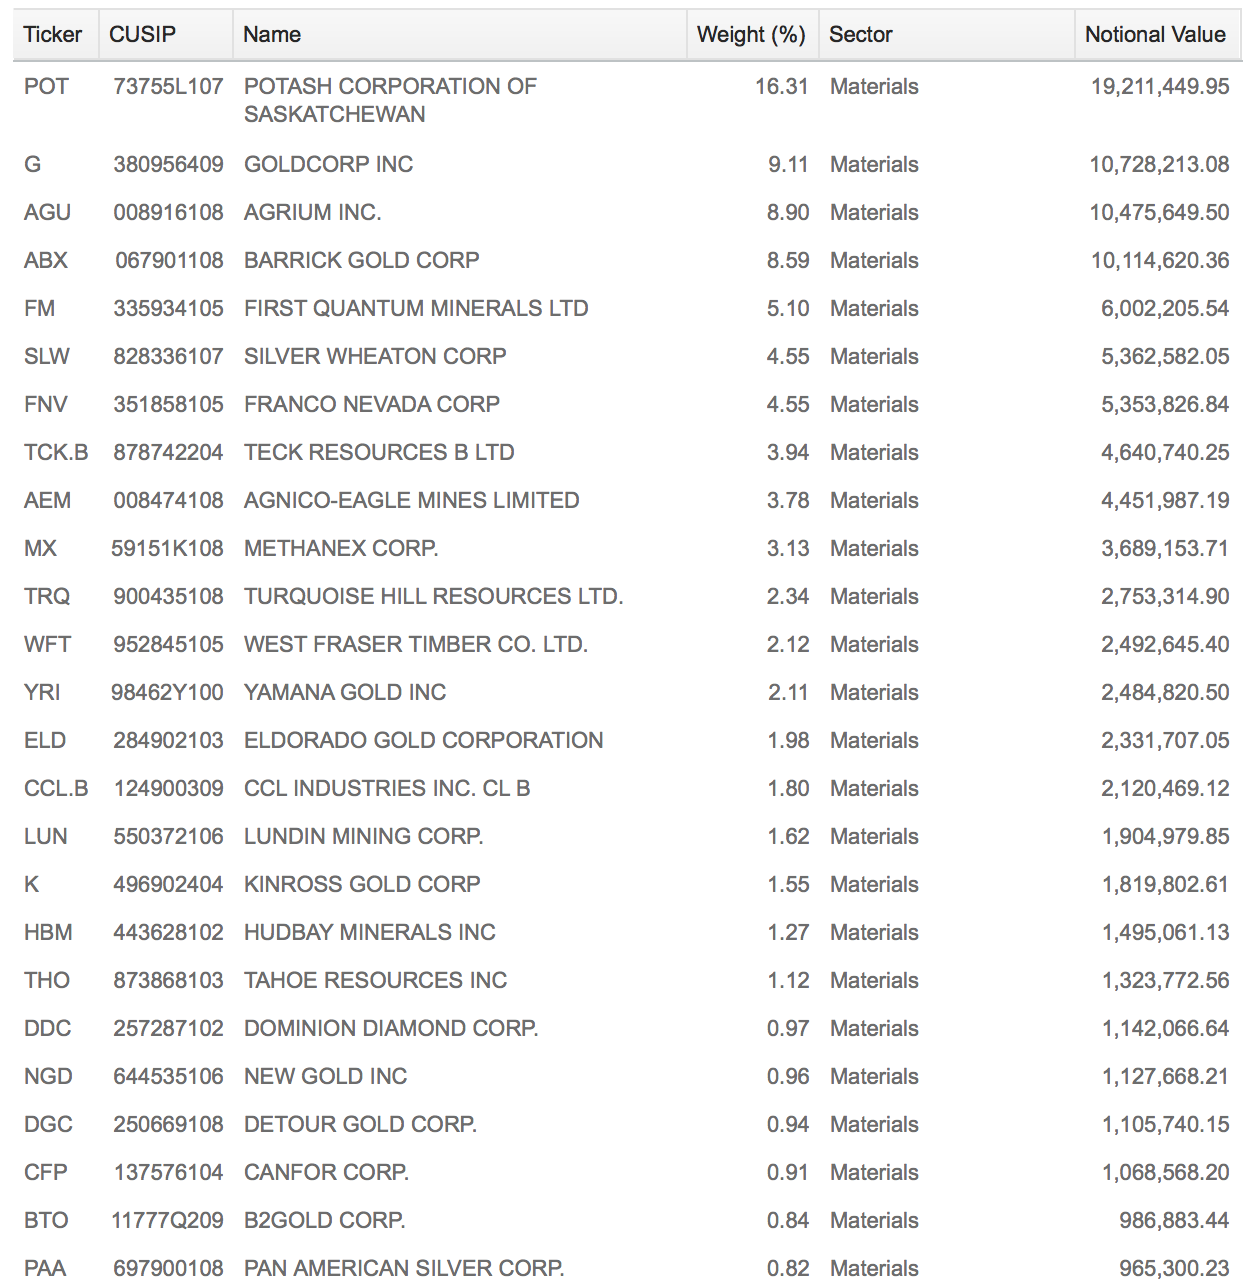
The Canadian Materials ETF (XMA.TO) is not quite as strong, but it is kicking it up! This chart has 6 rising lows, but the January/February spurious run had a bad week the first week of March. Other than that week the price action has been ok. One of the Top 10 big guns in the ETF is Teck Resources which hasn't started to jump yet. Below the chart, I have shown some of the ETF holdings. Back in 2014 this one had stronger volume, but it has been quiet lately. This one holds 16 % of Potash Corp which has pulled back from the highs.
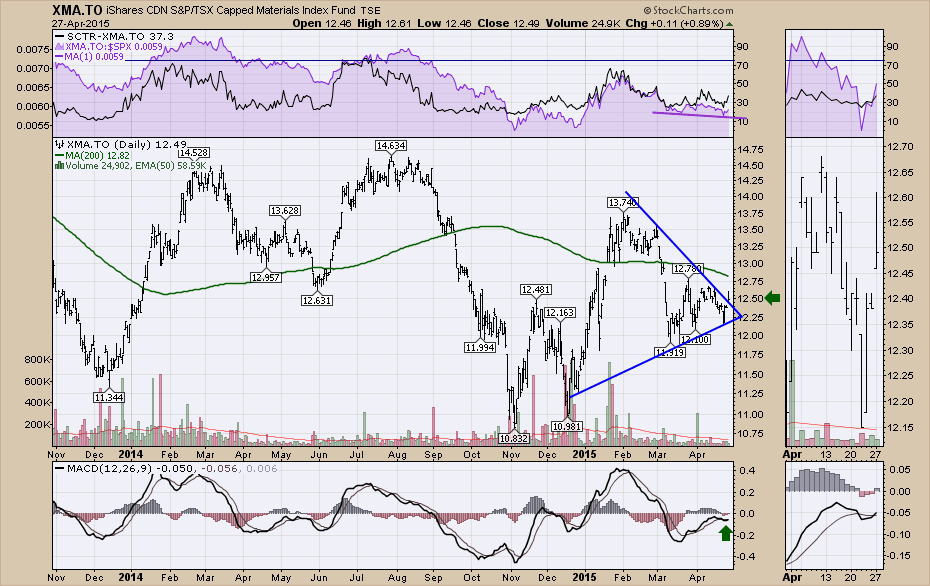
XMA.TO has some forestry in it, some gold, etc, so it is not purely industrial metals like the GSCI index.
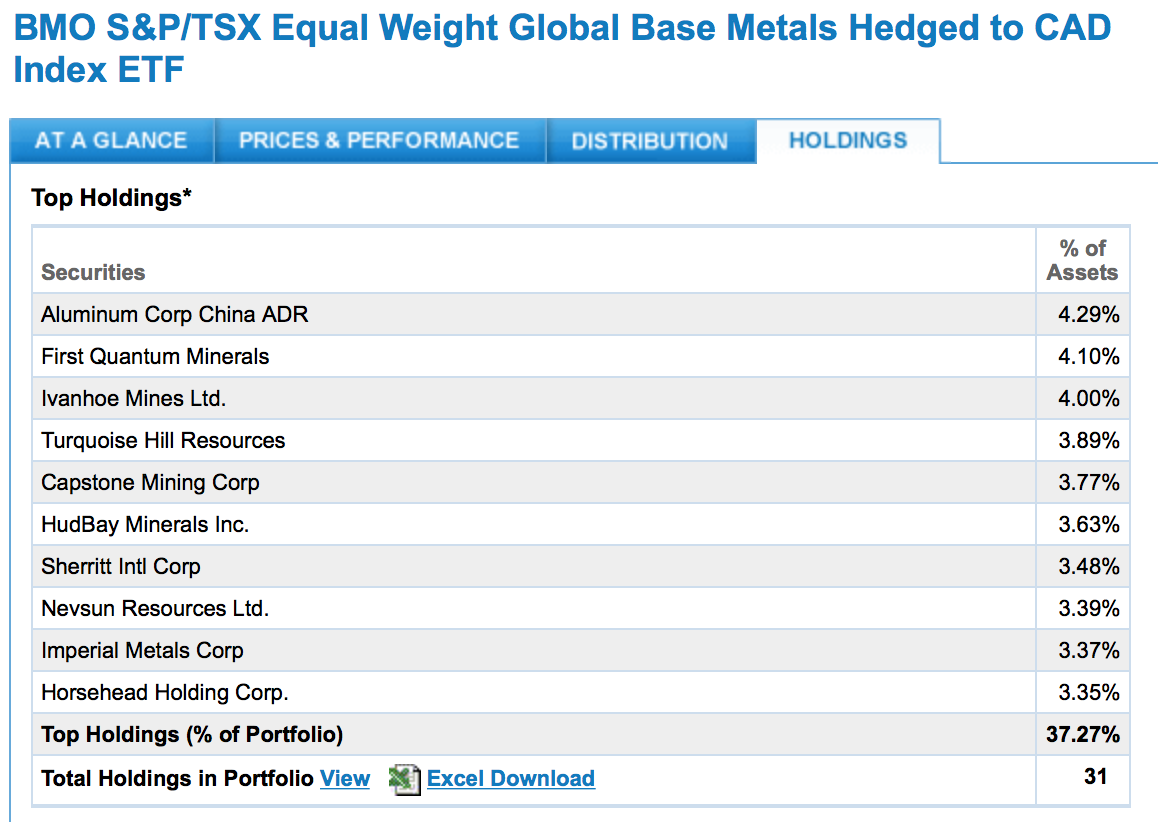
The BMO ETF for the Materials sector (ZMT.TO) is more of a pure base metals play but the volume is really light.
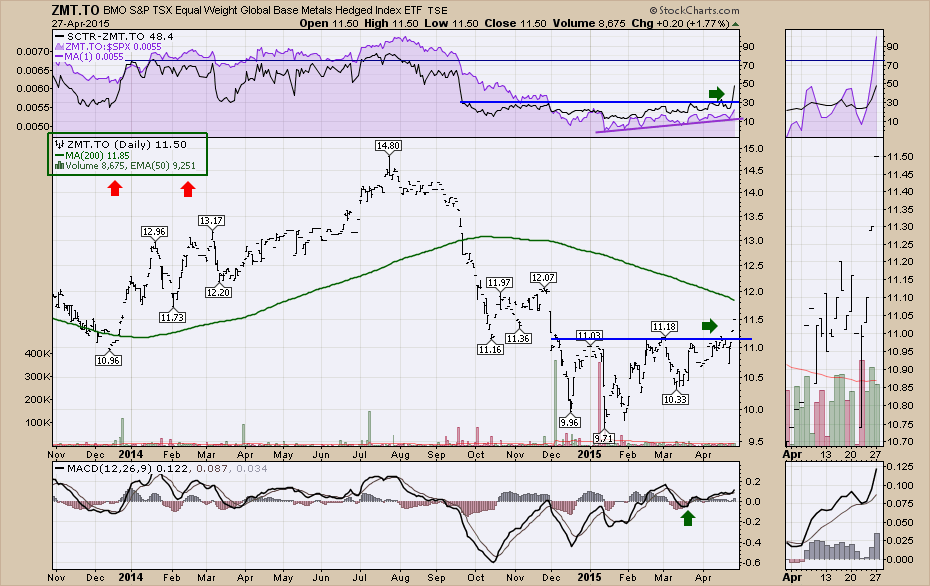
Here is a list of the top 10 stocks in ZMT.TO. No gold hanging out in this one.
The bottom line is this area of the market looks pretty interesting right now. If you listened in on some of the March Webinars I did before going on vacation, I was starting to find some interest in the area.
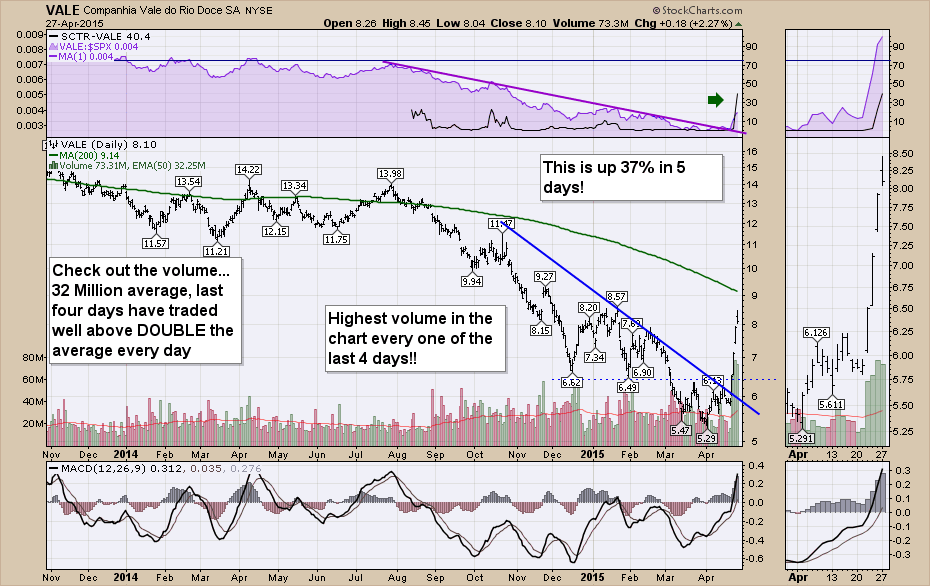
VALE has gone ballistic lately. It is up a mere 37% in a week! VALE made a nice little Head/Shoulders bottom after breaking the dotted support line.
I think there is something to this. The timing could not be better. Seeing Asia breaking out to new highs should lead us to the industrial metals getting some demand. Whether you use ETF's or directly play some of the stocks, don't put all your eggs in one stock. The charts are still trying to break out of bases for the most part, so it might not be clear which ones are going to be the strongest. You might be better to spread your capital across a few stocks or take an ETF approach. If this rolls over, make sure you have your exit plan.
Good trading,
Greg Schnell, CMT.


