We fired through a lot of charts on Tuesday. Here are some of the webinar highlights. The Canadian Stock Market ($TSX) continues its bear market trend. You can use this link to get to the webinar. The Canadian Technician 20150915
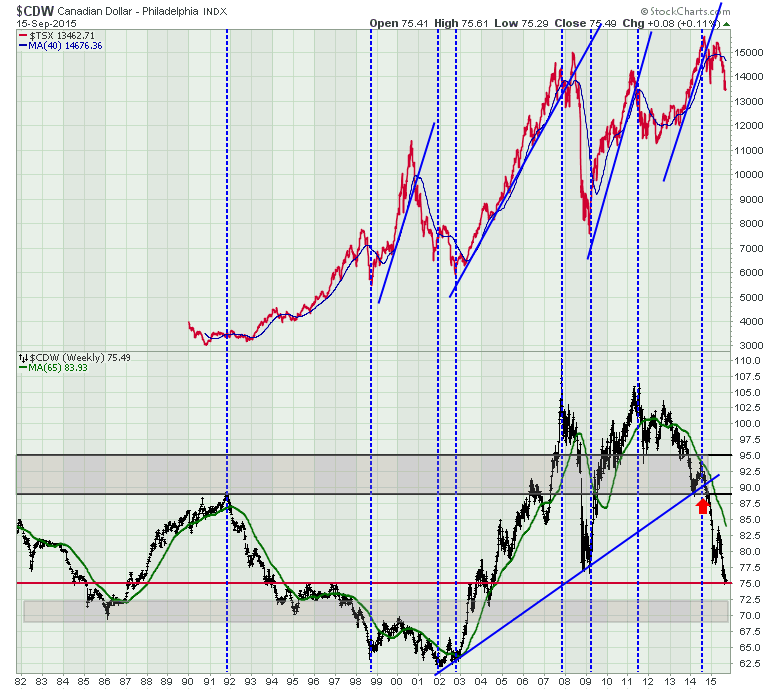
The Canadian Dollar ($CDW) has some support near the current levels at 75 but way more support at 69 to 72.50.
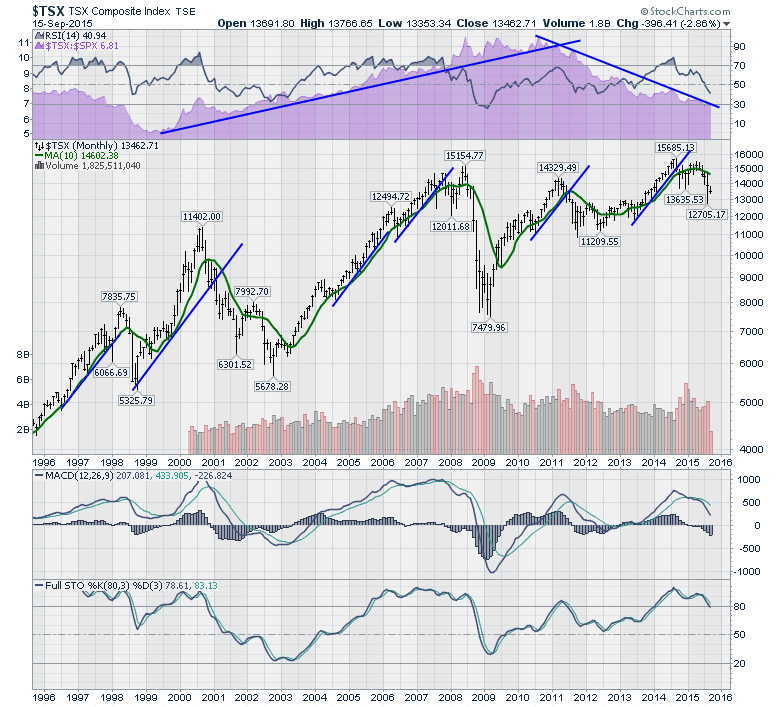
Below is the monthly chart of the $TSX. It still continues to underperform the SPX as shown in purple. The full stochastic breaking below 80 is a very bearish signal on the monthly chart. The $TSX is currently more than a 1000 points below the 10 month (~200 DMA).
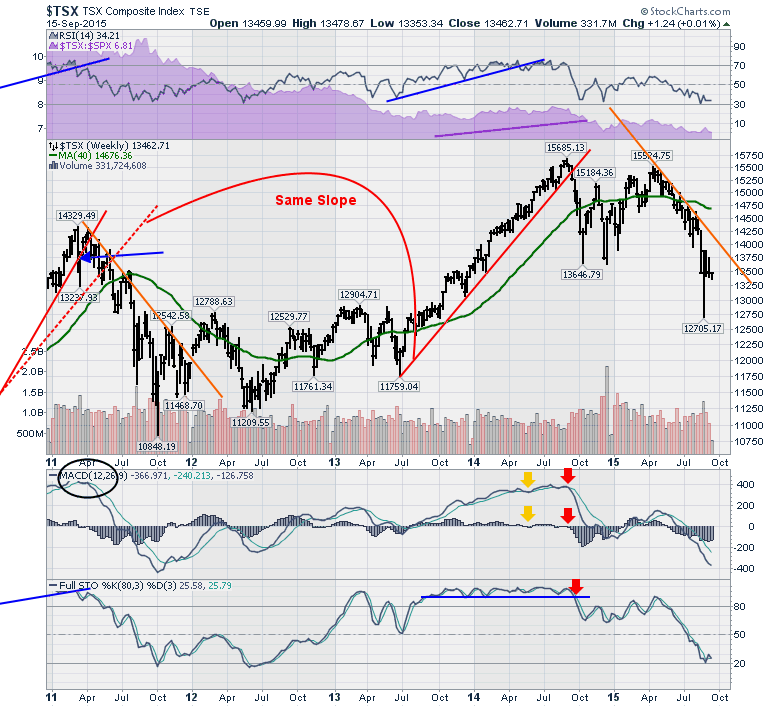
We spent a lot of time on interpreting the RSI on various weekly charts. Below 40 is a bear market signal and remains so as long as the RSI does not get back above 65. We got that bear signal in October 2014. Weekly MACD below zero or the Full stochastics falling below 80 are pretty powerful signals. The Canadian Technician 20150915
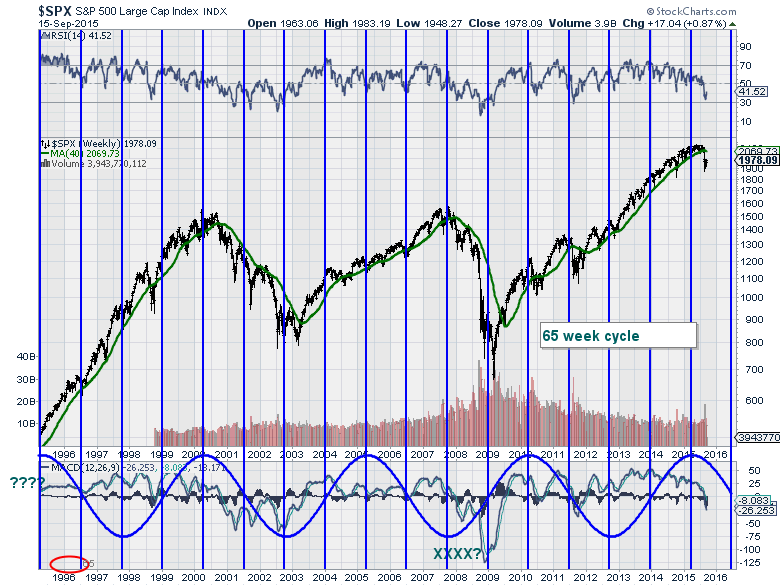
$SPX has an RSI below 40 so we have a bear market signal. The 65 week cycle topped closer to March, but the market didn't make any headway since then either. MACD is falling below zero as well. The Canadian Technician 20150915
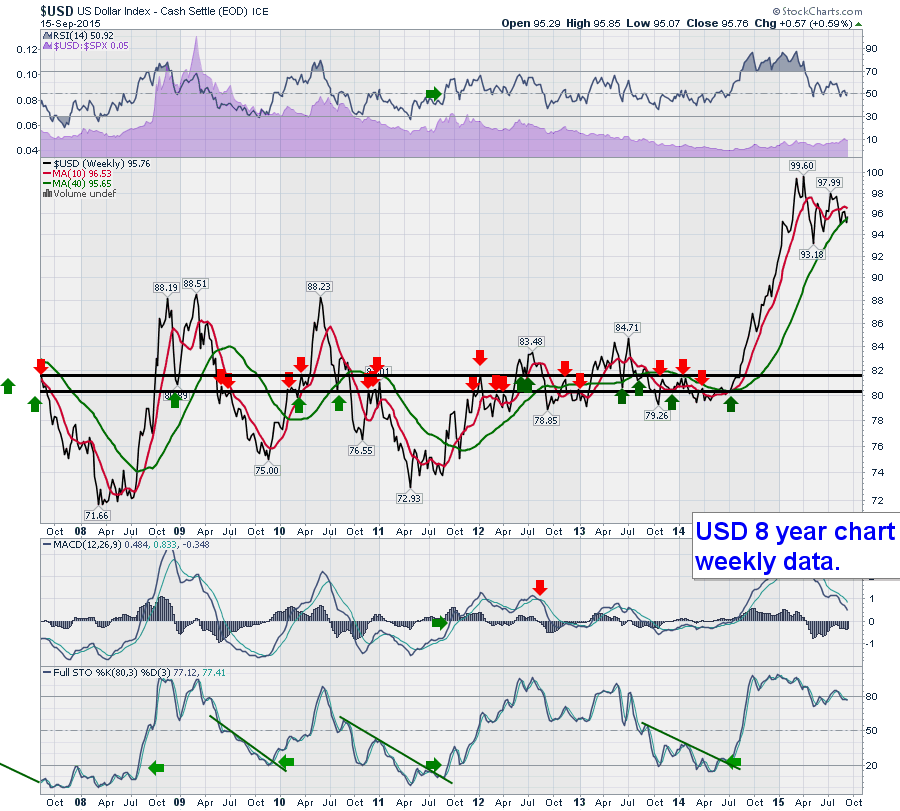
The $USD might be topping out here. It may fall below the 40 WMA in green. That would be helpful for commodities. Conversely, a bounce off the 40 WMA should be respected and that will put more pressure on commodities. The Canadian Technician 20150915
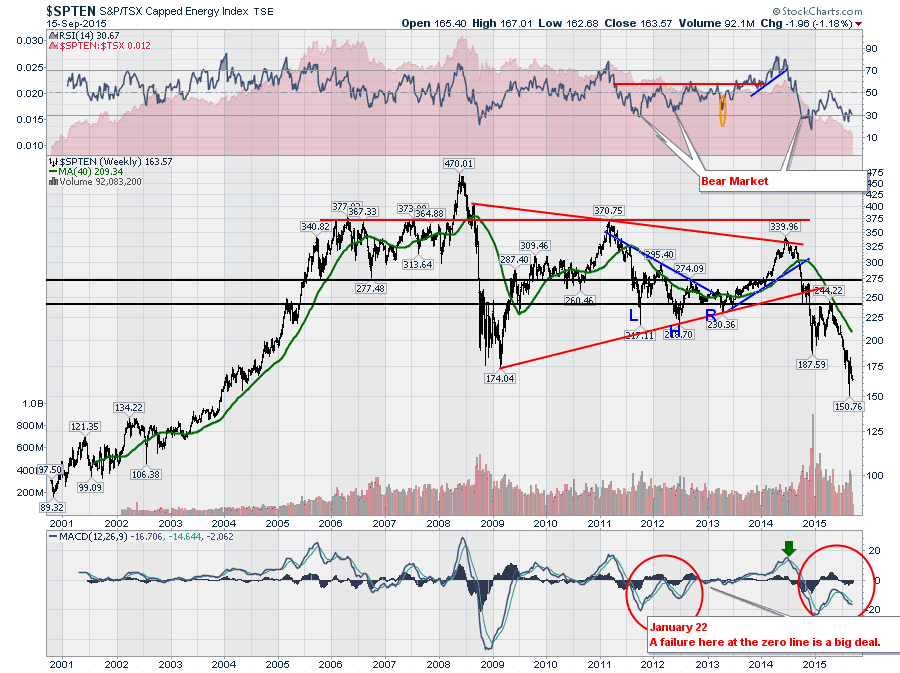
The MACD on the energy sector for Canada looks similar to the 2012 low where positive divergence showed up. We don't have a positive cross yet so it is important to watch.
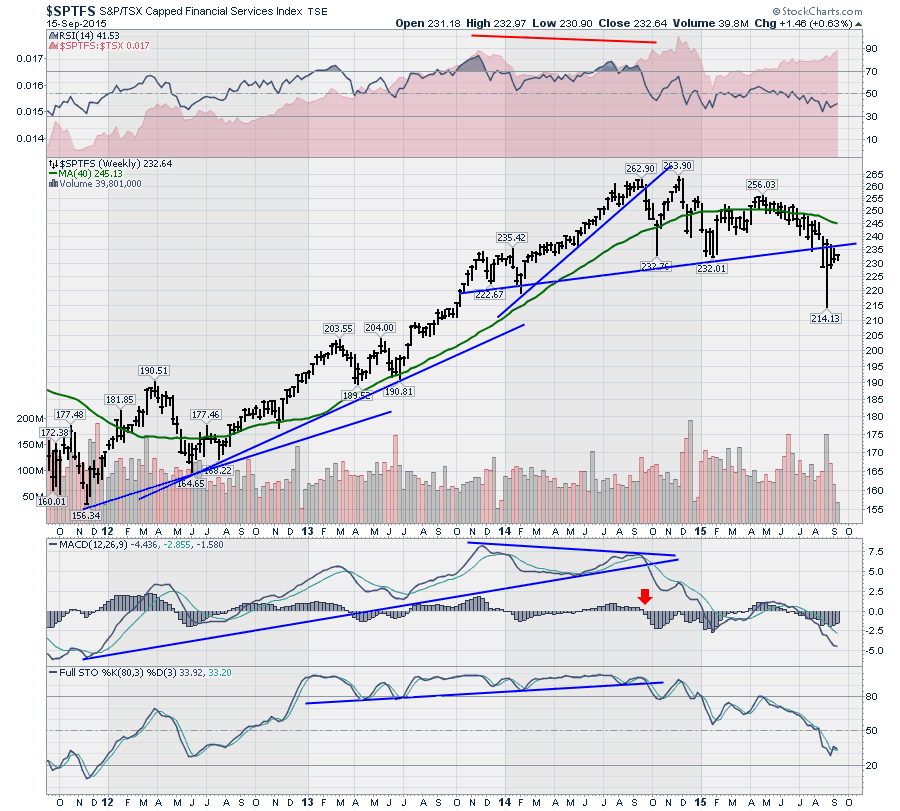
The Canadian Banks (most of the weighting of Financial Services sector) look like they have completed a multi year top and this bear market rally is a back test of the neck line.
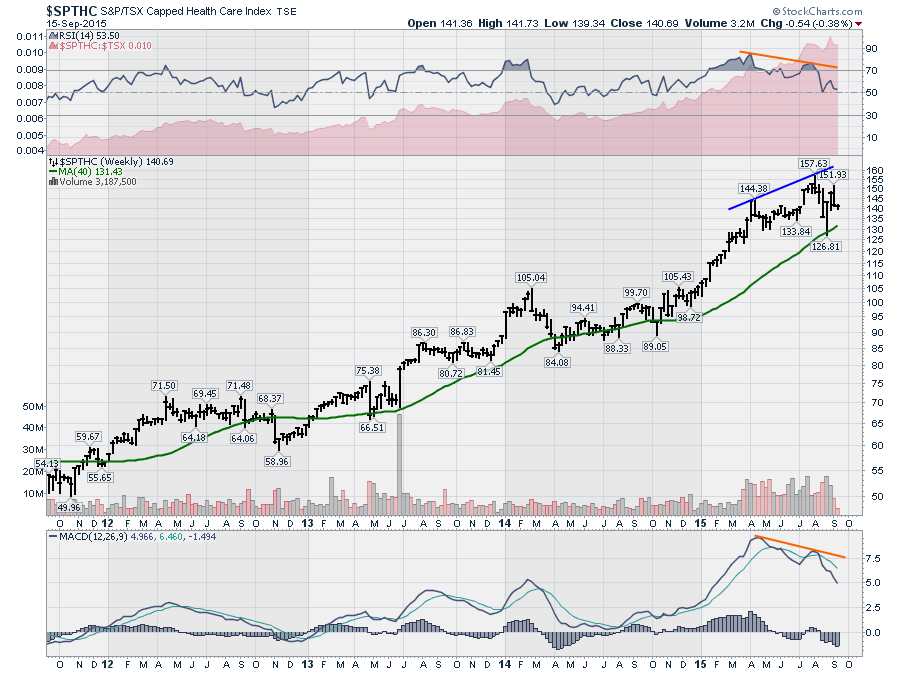
Some significant negative divergence on the Healthcare chart.
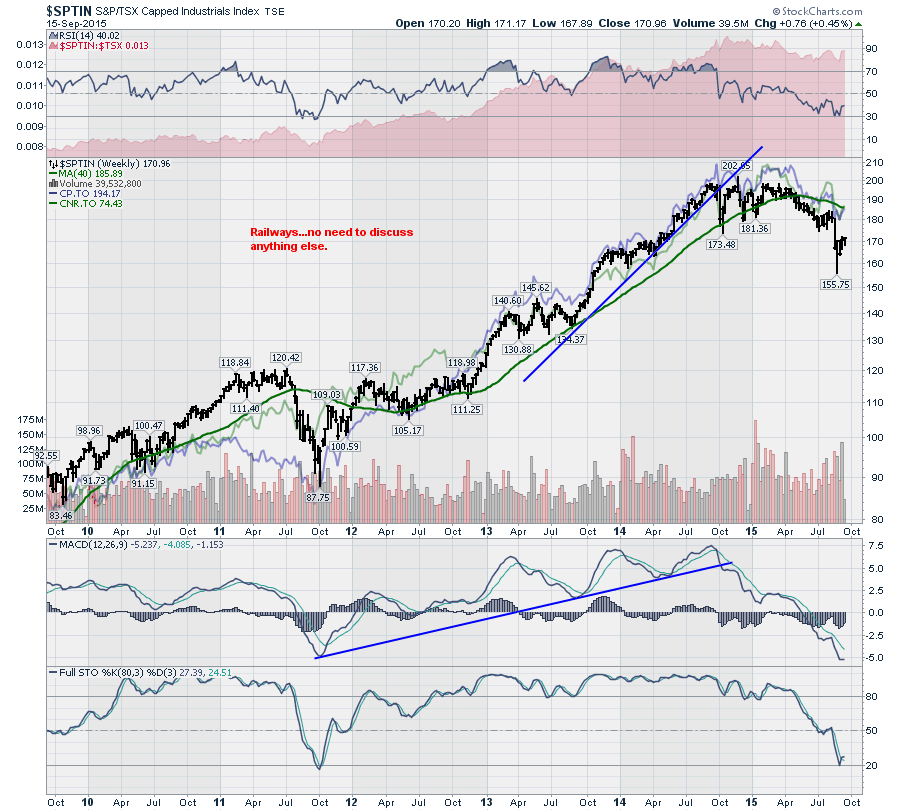
The Industrials sector soared the past few years. Not so much now. Bear market signals on the RSI showed up in June. The pale lines in the background are the railroads showing that they dominate the direction of this trend.
More sectors are on the webinar. The Canadian Technician 20150915
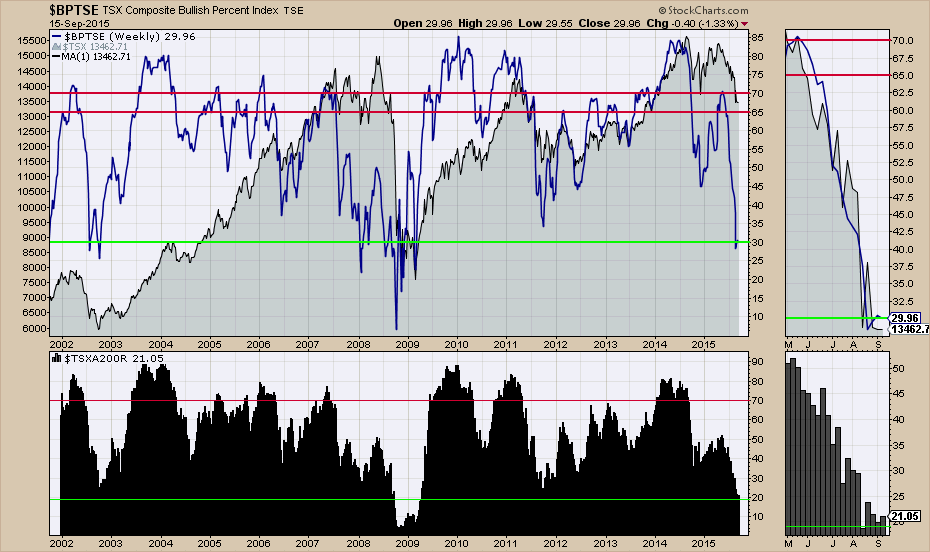
The levels we are currently at for the Bullish Percent Index and % of Stocks above the 200 DMA are the same as major long duration bear markets.
I covered off the $CRB and I covered off some breakouts for signaling Canada's next bull market.
Thanks for the warm show of support for the webinar content. Some of the feedback on yesterday's video was very specific and gave me great ideas on some new charts for the next broadcast. Thank you for sending that in. The Canadian Technician 20150915
Good trading,
Greg Schnell, CMT


