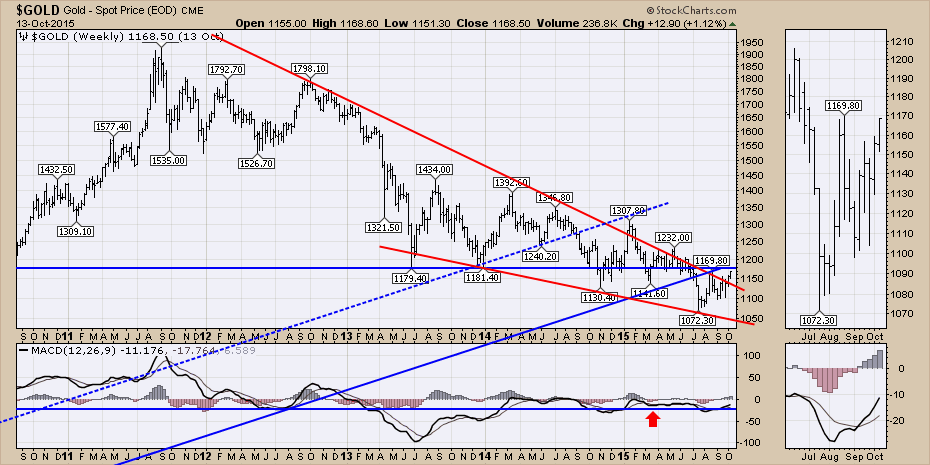
There has finally been some positive price action on Gold ($GOLD) and to some extent on the gold miners. Let's take a look. Gold has been building this red wedge for almost three years now. The past two weeks it broke above the trend line and tonight we'll see a taller candle approaching horizontal resistance around $1180.
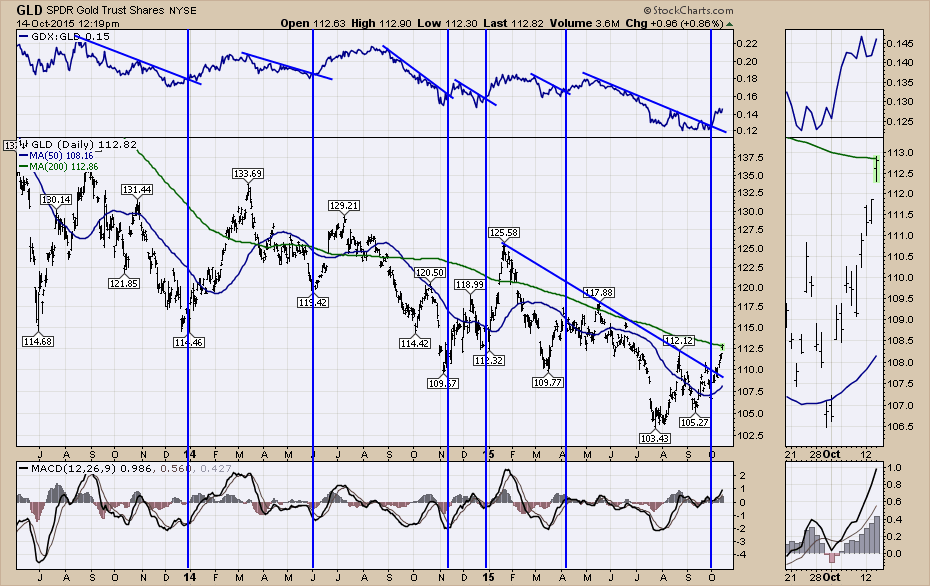
GLD on Chart 2 shows the price action at the 200 DMA today. We only spent one day above the 200 DMA back in May when it slammed back. This is an important area to watch. Notice when the 'GDX:GLD' ratio breaks out, gold usually goes on a run. Currently, we are 'On A Run'.
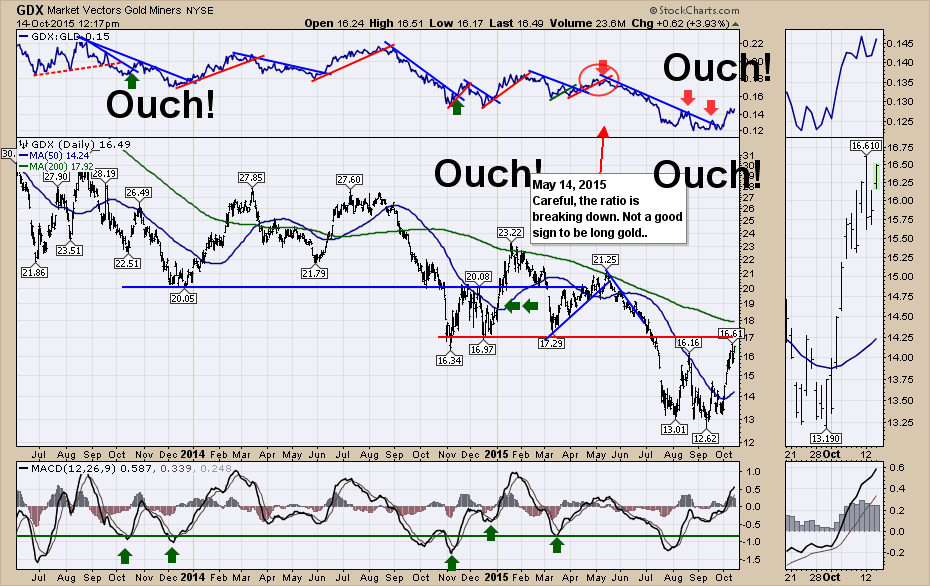
Here is a look at the miners. The 'Ouch' comments refer to places where the ratio started to break above the trend line then rolled back over.
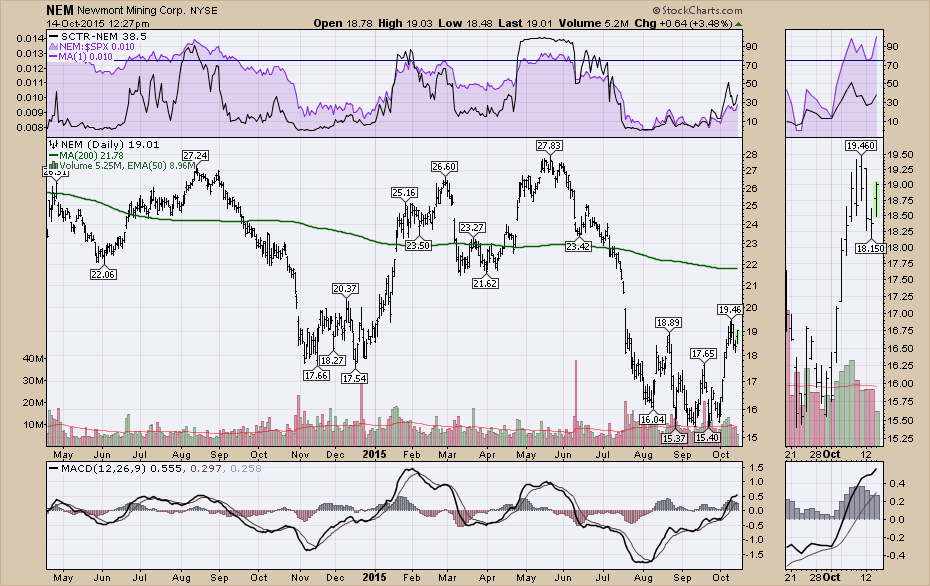
I have some concerns because some of the Gold charts that are near overhead resistance have not been able to blow through even though GLD has been climbing for two weeks. Let me give you some examples. Newmont Mining blew through resistance last week and looked like $19 was a rear view mirror number. But looking in the zoom panel on the chart below, you can see that it is back there today even though GLD made a higher high every day for the last 10. For something so oversold, I would have expected it to blow out topside.
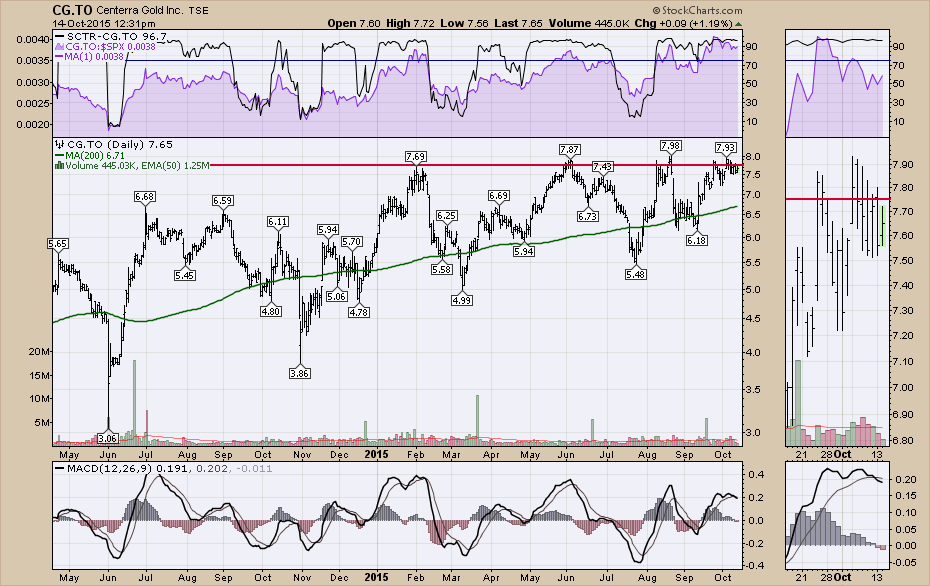
Here is another chart that has been pinned near the top for a while. Look in on the zoom box and we can see no real progress for ten days even though it has been close to breaking out.
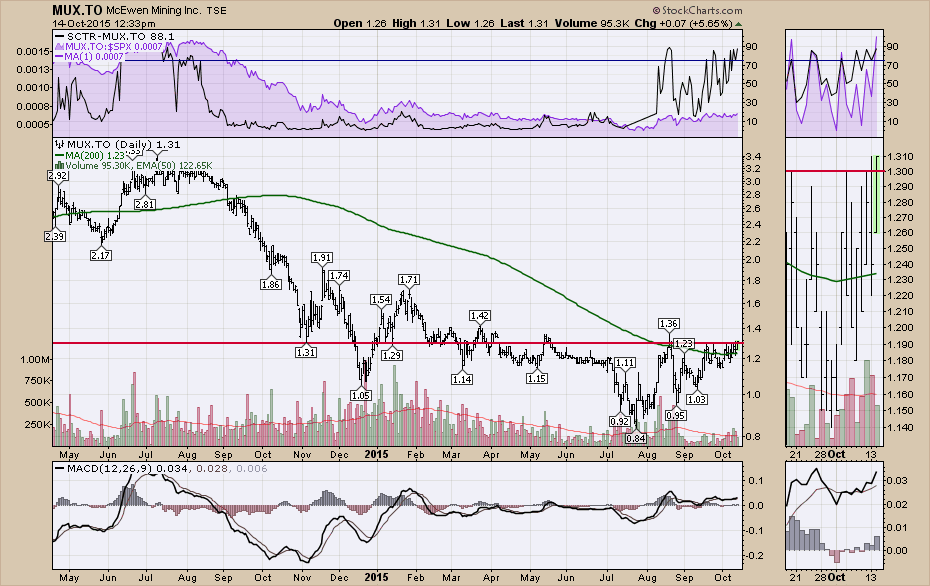
Here is MUX.TO. This is a sensitive little mining stock that trades on the US (MUX) and Canada. This little rocket booster can't seem to break away. It is trying again today.
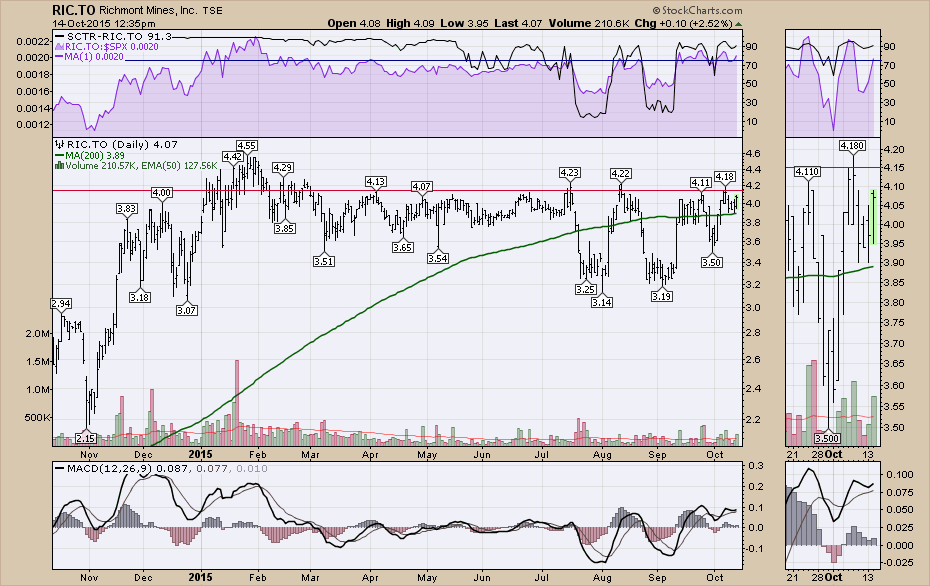
Here is Richmont Mines (RIC.TO).
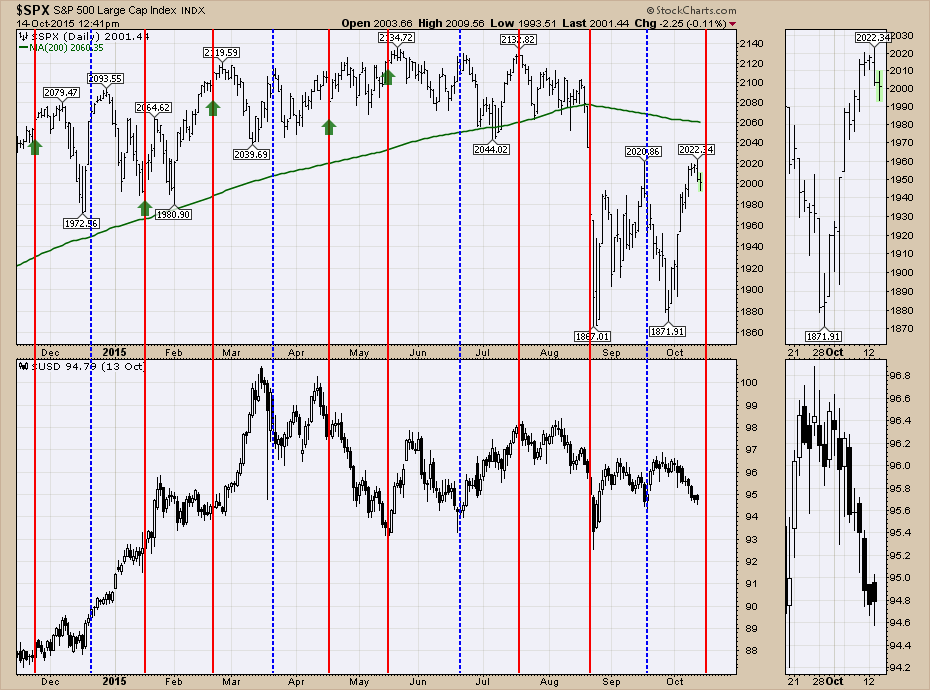
With the exception of Newmont, all of them have SCTR's above 75. I could add a lot more charts to this list, but the bottom line is they seem to be struggling to follow the move in GOLD to higher ground. 10 days up for $GOLD and all of these are sideways for the most part. I have one chart that concerns me about this move in $GOLD and it is the $USD chart. The real date it worries me is Friday. Below is a chart with the $SPX and the $USD is shown in black candles on the lower pane. The vertical lines represent Options Expiration days and one of those is showing up on Friday. The reason for my concern is the $USD has reversed direction on every options expiration day since the highs were made in the $SPX in May. So if that trend change is going to happen again on Friday, it would most likely be up as down is the current direction of the dollar. Over the next few days, if we see a reversal in the dollar, I would expect these Gold stocks to get pushed back down from their recent surge.
I posted a variety of Gold stocks here and there are also more like Goldcorp (G.TO) that are flying higher today that are not up against resistance. My point is that these really strong stocks that have been fighting the downtrend in GLD for months have been pushing up on the top right corner into resistance and even with ten days of effort, have not pushed through meaningfully. The bottom line for me is to be aware of the swings in the $USD between Thursday, Friday, and Monday. We could end up giving back these gold gains quickly.
I have a Commodities Countdown webinar on Thursday at 5 EST. We'll be covering off a lot of the intricacies of the commodities here. I look forward to you joining me. Click on the link to register. Perhaps the webinar is where the GOLD lovers will unite this week!
Good trading,
Greg Schnell, CMT

